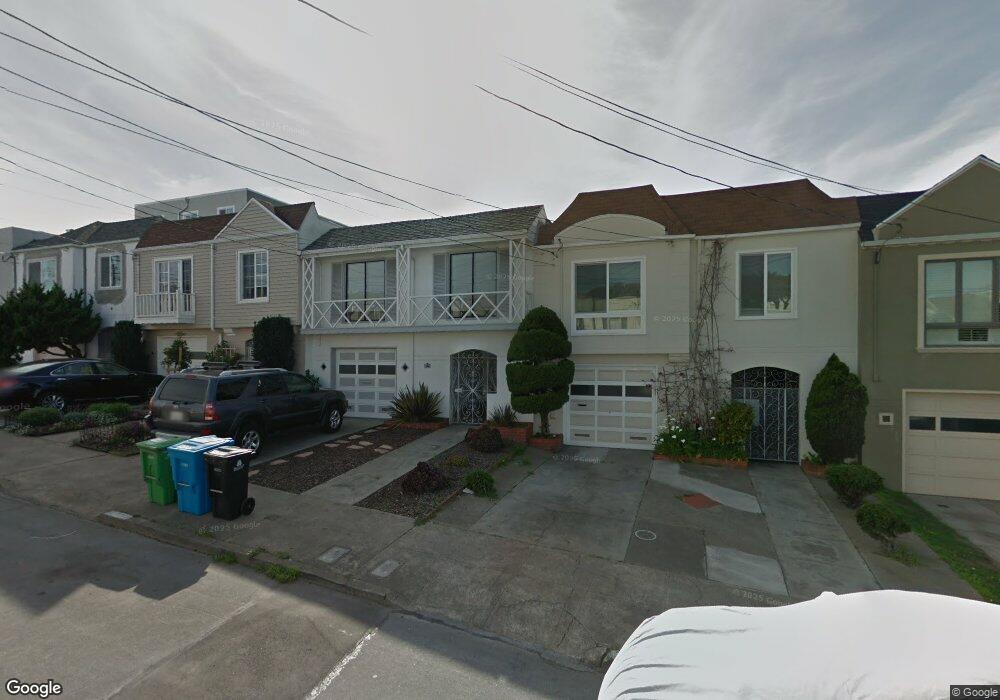
2171 41st Ave San Francisco, CA 94116
Outer Parkside NeighborhoodEstimated Value: $1,169,452 - $1,656,000
--
Bed
1
Bath
1,137
Sq Ft
$1,207/Sq Ft
Est. Value
About This Home
This home is located at 2171 41st Ave, San Francisco, CA 94116 and is currently estimated at $1,372,363, approximately $1,207 per square foot. 2171 41st Ave is a home located in San Francisco County with nearby schools including Sunset Elementary School, Giannini (A.P.) Middle School, and St. Gabriel School.
Ownership History
Date
Name
Owned For
Owner Type
Purchase Details
Closed on
Mar 25, 2020
Sold by
Corbolotti Robert J
Bought by
Corbolotti Robert J and Corbolotti Annette M
Current Estimated Value
Purchase Details
Closed on
Oct 29, 2019
Sold by
Navarro Patricia C and Navarro Patricia A
Bought by
Navarro Marciano F and Navarro Patricia C
Purchase Details
Closed on
Jun 24, 2016
Sold by
Corbolotti Robert J
Bought by
Corbolotti Robert J and Navarro Patricia A
Purchase Details
Closed on
Nov 9, 2005
Sold by
Corbolotti Frances E and Corbolotti Robert J
Bought by
Corbolotti Frances E and Corbolotti Robert J
Purchase Details
Closed on
Mar 8, 1994
Sold by
Corbolotti Joseph J and Corbolotti Frances B
Bought by
Corbolotti Joseph J and Corbolotti Frances B
Create a Home Valuation Report for This Property
The Home Valuation Report is an in-depth analysis detailing your home's value as well as a comparison with similar homes in the area
Home Values in the Area
Average Home Value in this Area
Purchase History
| Date | Buyer | Sale Price | Title Company |
|---|---|---|---|
| Corbolotti Robert J | -- | None Available | |
| Navarro Marciano F | -- | None Available | |
| Corbolotti Robert J | -- | None Available | |
| Corbolotti Robert J | -- | None Available | |
| Corbolotti Frances E | -- | None Available | |
| Corbolotti Joseph J | -- | -- |
Source: Public Records
Tax History Compared to Growth
Tax History
| Year | Tax Paid | Tax Assessment Tax Assessment Total Assessment is a certain percentage of the fair market value that is determined by local assessors to be the total taxable value of land and additions on the property. | Land | Improvement |
|---|---|---|---|---|
| 2025 | $1,568 | $67,806 | $32,512 | $35,294 |
| 2024 | $1,568 | $66,478 | $31,876 | $34,602 |
| 2023 | $1,533 | $65,176 | $31,252 | $33,924 |
| 2022 | $1,486 | $63,900 | $30,640 | $33,260 |
| 2021 | $1,454 | $62,648 | $30,040 | $32,608 |
| 2020 | $1,483 | $62,006 | $29,732 | $32,274 |
| 2019 | $1,437 | $60,738 | $29,126 | $31,612 |
| 2018 | $1,391 | $59,550 | $28,556 | $30,994 |
| 2017 | $995 | $58,451 | $28,033 | $30,418 |
| 2016 | $945 | $57,307 | $27,484 | $29,823 |
| 2015 | $930 | $56,448 | $27,072 | $29,376 |
| 2014 | $906 | $55,345 | $26,543 | $28,802 |
Source: Public Records
Map
Nearby Homes