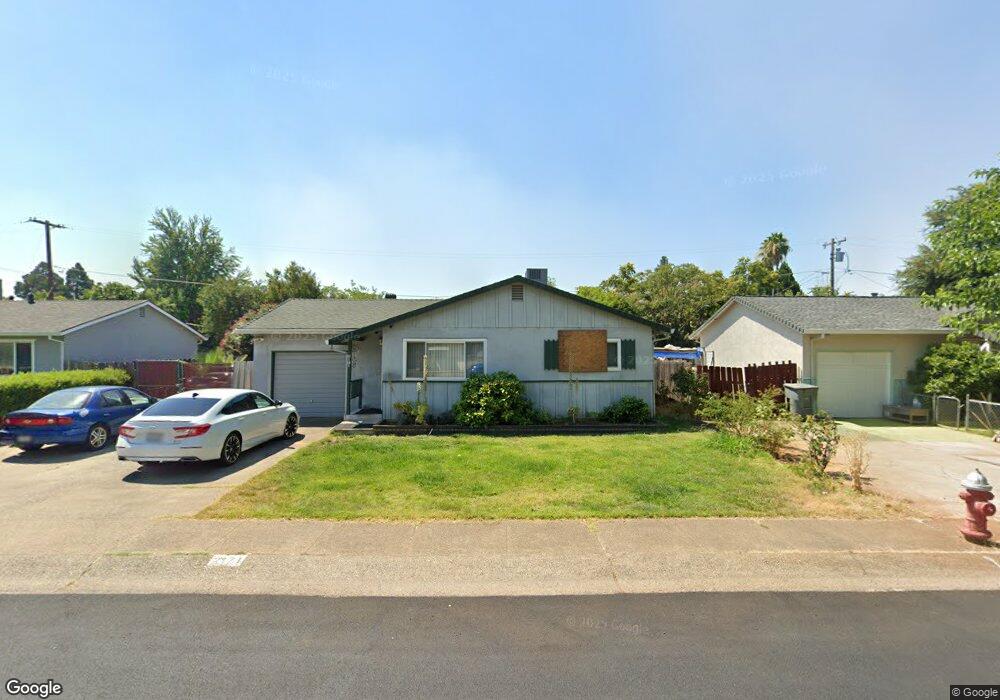
2171 Solar Way Redding, CA 96002
Starview NeighborhoodEstimated Value: $236,000 - $257,000
3
Beds
1
Bath
936
Sq Ft
$261/Sq Ft
Est. Value
About This Home
This home is located at 2171 Solar Way, Redding, CA 96002 and is currently estimated at $244,233, approximately $260 per square foot. 2171 Solar Way is a home located in Shasta County with nearby schools including Alta Mesa Elementary School, Parsons Junior High School, and Enterprise High School.
Ownership History
Date
Name
Owned For
Owner Type
Purchase Details
Closed on
Feb 7, 2019
Sold by
Grossen Pamela J
Bought by
Grossen Thomas and Grossen Pamela J
Current Estimated Value
Purchase Details
Closed on
Jan 23, 2019
Sold by
Grossen Pamela J and William E And Joy M Russell Re
Bought by
Grossen Pamela J
Purchase Details
Closed on
Feb 7, 2014
Sold by
Russell William and Russell Joy Marlene
Bought by
William E & Joy M Russell Revocable Trus and Russell Joy M
Purchase Details
Closed on
Nov 26, 2008
Sold by
Russell Joy Marlene
Bought by
Russell William and Russell Joy Marlene
Home Financials for this Owner
Home Financials are based on the most recent Mortgage that was taken out on this home.
Original Mortgage
$140,160
Interest Rate
6.04%
Mortgage Type
FHA
Create a Home Valuation Report for This Property
The Home Valuation Report is an in-depth analysis detailing your home's value as well as a comparison with similar homes in the area
Home Values in the Area
Average Home Value in this Area
Purchase History
| Date | Buyer | Sale Price | Title Company |
|---|---|---|---|
| Grossen Thomas | -- | None Available | |
| Grossen Pamela J | -- | None Available | |
| William E & Joy M Russell Revocable Trus | -- | None Available | |
| Russell William | -- | Lsi |
Source: Public Records
Mortgage History
| Date | Status | Borrower | Loan Amount |
|---|---|---|---|
| Previous Owner | Russell William | $140,160 |
Source: Public Records
Tax History Compared to Growth
Tax History
| Year | Tax Paid | Tax Assessment Tax Assessment Total Assessment is a certain percentage of the fair market value that is determined by local assessors to be the total taxable value of land and additions on the property. | Land | Improvement |
|---|---|---|---|---|
| 2025 | $522 | $52,008 | $10,930 | $41,078 |
| 2024 | $513 | $50,989 | $10,716 | $40,273 |
| 2023 | $513 | $49,990 | $10,506 | $39,484 |
| 2022 | $497 | $49,010 | $10,300 | $38,710 |
| 2021 | $478 | $48,050 | $10,099 | $37,951 |
| 2020 | $475 | $47,558 | $9,996 | $37,562 |
| 2019 | $485 | $46,626 | $9,800 | $36,826 |
| 2018 | $539 | $45,712 | $9,608 | $36,104 |
| 2017 | $548 | $44,817 | $9,420 | $35,397 |
| 2016 | $514 | $43,939 | $9,236 | $34,703 |
| 2015 | $509 | $43,280 | $9,098 | $34,182 |
| 2014 | $506 | $42,433 | $8,920 | $33,513 |
Source: Public Records
Map
Nearby Homes
- 2068 Solar Way
- 2145 Venus Way
- 3361 Alta Mesa Dr
- 3341 Timbercreek Dr
- 3466 Silverwood St
- 3688 Polaris Way
- 2269 Corona St
- 3475 Oak Haven Ct
- 3897 Sunwood Dr
- 3387 Bridger Dr
- 3512 Capricorn Way
- 2408 Castlewood Dr
- 3849 Capricorn Way
- 3628 Somerset Ave
- 0 Shasta View Unit 25-1945
- 4151 Saratoga Dr
- 3340 Hartnell Ave
- 3293 Middleton Ln
- 3283 Middleton Ln
- 3149 Leonard St
- 2185 Solar Way
- 3644 Alta Mesa Dr
- 2159 Solar Way
- 2186 Solar Way
- 2172 Solar Way
- 3664 Alta Mesa Dr
- 2164 Neptune Terrace
- 2198 Solar Way
- 2160 Solar Way
- 2176 Neptune Terrace
- 2145 Solar Way
- 3676 Alta Mesa Dr
- 2152 Neptune Terrace
- 2146 Solar Way
- 3596 Alta Mesa Dr
- 2163 Jupiter Terrace
- 2133 Solar Way
- 2223 Solar Way
- 2169 Jupiter Terrace
- 2140 Neptune Terrace