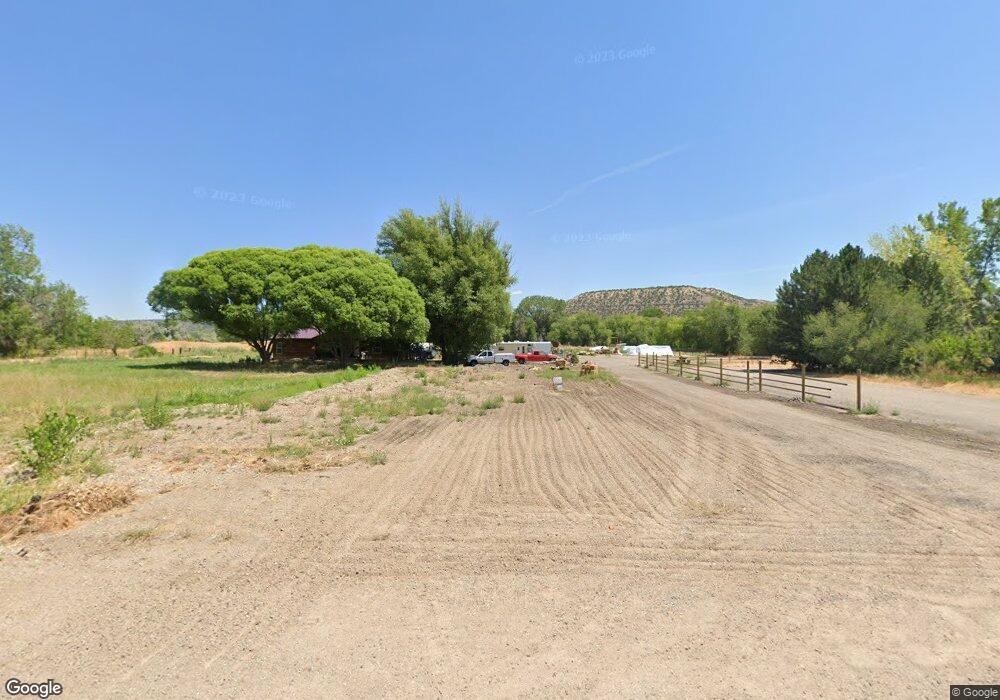
2172 45 1 2 Rd de Beque, CO 81630
Estimated Value: $601,854 - $790,000
3
Beds
2
Baths
2,688
Sq Ft
$252/Sq Ft
Est. Value
About This Home
This home is located at 2172 45 1 2 Rd, de Beque, CO 81630 and is currently estimated at $676,964, approximately $251 per square foot. 2172 45 1 2 Rd is a home located in Mesa County with nearby schools including De Beque School.
Ownership History
Date
Name
Owned For
Owner Type
Purchase Details
Closed on
Mar 8, 2012
Sold by
Cogburn Ray
Bought by
Cogburn Rodney and Cogburn Ray
Current Estimated Value
Home Financials for this Owner
Home Financials are based on the most recent Mortgage that was taken out on this home.
Original Mortgage
$270,326
Outstanding Balance
$189,027
Interest Rate
4.25%
Mortgage Type
FHA
Estimated Equity
$487,937
Purchase Details
Closed on
Mar 7, 2012
Sold by
Cogburn Rodney
Bought by
Cogburn Ray
Home Financials for this Owner
Home Financials are based on the most recent Mortgage that was taken out on this home.
Original Mortgage
$270,326
Outstanding Balance
$189,027
Interest Rate
4.25%
Mortgage Type
FHA
Estimated Equity
$487,937
Purchase Details
Closed on
Sep 22, 2009
Sold by
Walcher Benjamin and Walcher Sheree
Bought by
Cogburn Rodney and Cogburn Ray
Create a Home Valuation Report for This Property
The Home Valuation Report is an in-depth analysis detailing your home's value as well as a comparison with similar homes in the area
Purchase History
| Date | Buyer | Sale Price | Title Company |
|---|---|---|---|
| Cogburn Rodney | -- | Land Title Guarantee Company | |
| Cogburn Ray | -- | Land Title Guarantee Company | |
| Cogburn Rodney | -- | None Available |
Source: Public Records
Mortgage History
| Date | Status | Borrower | Loan Amount |
|---|---|---|---|
| Open | Cogburn Ray | $270,326 |
Source: Public Records
Tax History
| Year | Tax Paid | Tax Assessment Tax Assessment Total Assessment is a certain percentage of the fair market value that is determined by local assessors to be the total taxable value of land and additions on the property. | Land | Improvement |
|---|---|---|---|---|
| 2024 | $395 | $13,600 | $30 | $13,570 |
| 2023 | $395 | $13,600 | $30 | $13,570 |
| 2022 | $806 | $28,800 | $30 | $28,770 |
| 2021 | $768 | $26,740 | $30 | $26,710 |
| 2020 | $699 | $25,470 | $30 | $25,440 |
| 2019 | $585 | $25,470 | $30 | $25,440 |
| 2018 | $745 | $27,240 | $30 | $27,210 |
| 2017 | $780 | $27,240 | $30 | $27,210 |
| 2016 | $731 | $25,890 | $30 | $25,860 |
Source: Public Records
Map
Nearby Homes
- TBD V Rd Unit Lot 6
- 576 Stewart Ave
- 234 Lena Ln
- 4399 44 Rd
- 447 Denver Ave
- 580 Denver Ave
- 680 Curtis Ave
- 647 Denver Ave
- 700 Denver Ave Unit 14
- 4695 Highway 6 & 24
- 1951 I-70 Frontage Rd
- TBD Hwy 6 & 24 Unit L6
- 15086 45 1 2 Rd
- 4599 Horse Canyon Rd
- 4546 Horse Canyon Rd
- TBD County Road 306
- 0 Mosher Ave Unit 23154063
- 4521 Horse Canyon Rd
- TBD Mosher Ave
- TBD Buds Way
Your Personal Tour Guide
Ask me questions while you tour the home.