2172 Posada Dr Oxnard, CA 93030
East Village NeighborhoodEstimated Value: $538,999 - $791,000
3
Beds
2
Baths
1,279
Sq Ft
$543/Sq Ft
Est. Value
About This Home
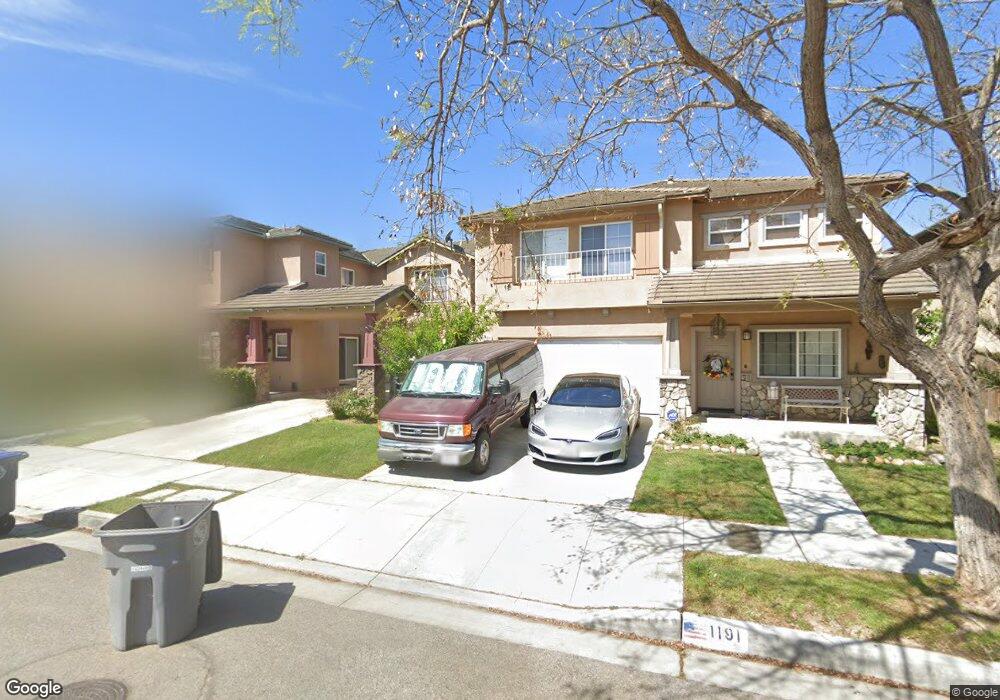
This home is located at 2172 Posada Dr, Oxnard, CA 93030 and is currently estimated at $694,500, approximately $543 per square foot. 2172 Posada Dr is a home located in Ventura County with nearby schools including Rio Rosales Elementary School, Rio Del Valle Middle School, and Our Lady Of Guadalupe Elementary School.
Ownership History
Date
Name
Owned For
Owner Type
Purchase Details
Closed on
Jun 25, 2018
Sold by
Marquez Rosendo Flores and Marquez Ramona Monique
Bought by
Marquez Ramona Monique
Current Estimated Value
Purchase Details
Closed on
Nov 18, 2005
Sold by
Marquez Rosendo Flores
Bought by
Marquez Rosendo Flores and Marquez Ramona Monique
Purchase Details
Closed on
Dec 19, 2002
Sold by
Mayfield Village Llc
Bought by
Marquez Rosendo Flores and Marquez Ramona Monique
Home Financials for this Owner
Home Financials are based on the most recent Mortgage that was taken out on this home.
Original Mortgage
$166,000
Interest Rate
5.96%
Mortgage Type
Purchase Money Mortgage
Create a Home Valuation Report for This Property
The Home Valuation Report is an in-depth analysis detailing your home's value as well as a comparison with similar homes in the area
Home Values in the Area
Average Home Value in this Area
Purchase History
| Date | Buyer | Sale Price | Title Company |
|---|---|---|---|
| Marquez Ramona Monique | -- | None Available | |
| Marquez Rosendo Flores | -- | -- | |
| Marquez Rosendo Flores | $170,000 | First American Title Co |
Source: Public Records
Mortgage History
| Date | Status | Borrower | Loan Amount |
|---|---|---|---|
| Previous Owner | Marquez Rosendo Flores | $166,000 |
Source: Public Records
Tax History
| Year | Tax Paid | Tax Assessment Tax Assessment Total Assessment is a certain percentage of the fair market value that is determined by local assessors to be the total taxable value of land and additions on the property. | Land | Improvement |
|---|---|---|---|---|
| 2025 | $3,110 | $238,946 | $119,475 | $119,471 |
| 2024 | $3,110 | $234,261 | $117,132 | $117,129 |
| 2023 | $2,715 | $229,668 | $114,835 | $114,833 |
| 2022 | $2,925 | $225,165 | $112,583 | $112,582 |
| 2021 | $2,921 | $220,750 | $110,375 | $110,375 |
| 2020 | $2,922 | $218,490 | $109,245 | $109,245 |
| 2019 | $2,743 | $214,206 | $107,103 | $107,103 |
| 2018 | $2,539 | $210,006 | $105,003 | $105,003 |
| 2017 | $2,460 | $205,890 | $102,945 | $102,945 |
| 2016 | $2,453 | $201,854 | $100,927 | $100,927 |
| 2015 | $2,595 | $198,824 | $99,412 | $99,412 |
| 2014 | $2,491 | $194,930 | $97,465 | $97,465 |
Source: Public Records
Map
Nearby Homes
- 2030 Ocaso Place
- 902 Paseo Brisas Lindas
- 1930 Ribera Dr
- 1902 Ribera Dr Unit 86
- 2300 Latigo Ave
- 2010 Camino Del Sol
- 211 Featherstone St
- 517 Orilla Walk
- 1111 Echo St
- 2701 Alvarado St
- 136 N Garfield Ave
- 0 Alvarado St
- 400 N Hayes Ave
- 208 Bolero Ln
- 403 E 2nd St
- 207 Hermano Trail
- 139 Stanford Ave
- 2151 E Wooley Rd
- 255 Douglas Ave
- 2012 Blackberry Cir
- 2170 Posada Dr
- 2174 Posada Dr Unit 28
- 2168 Posada Dr
- 2176 Posada Dr
- 2178 Posada Dr
- 2107 Ocaso Place
- 2109 Ocaso Place
- 2105 Ocaso Place
- 2166 Posada Dr Unit 32
- 2180 Posada Dr
- 2111 Ocaso Place
- 1181 Lombard St
- 1171 Lombard St Unit 17
- 1191 Lombard St
- 2103 Ocaso Place
- 2182 Posada Dr Unit 24
- 2182 Posada Dr
- 1201 Lombard St
- 2181 Posada Dr
- 2113 Ocaso Place