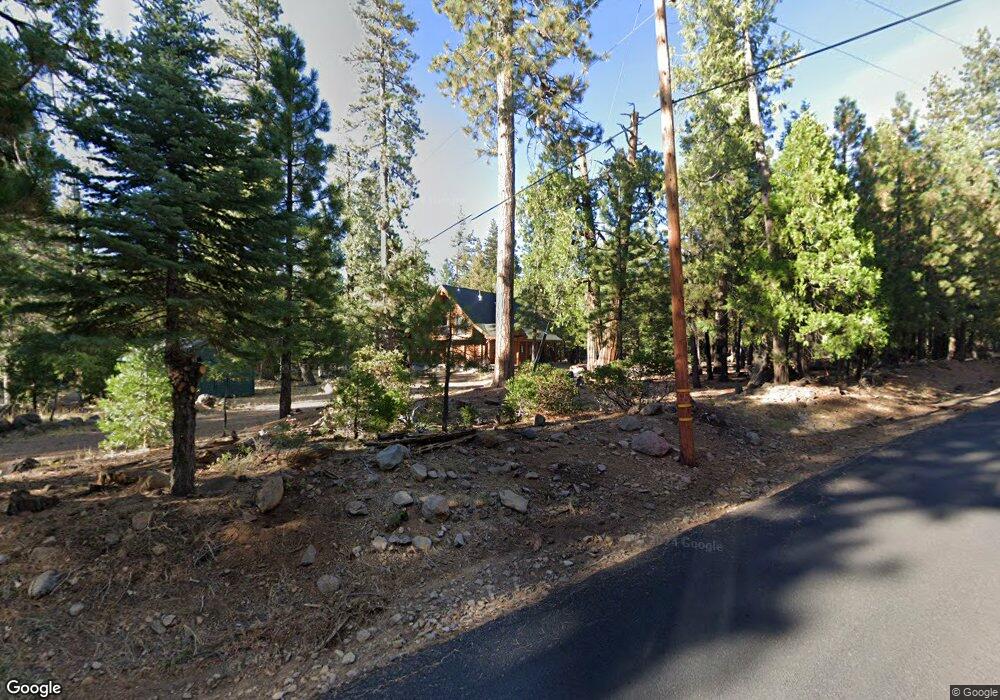
21724 Deacon Row Forest Ranch, CA 95942
Estimated Value: $377,000 - $437,000
--
Bed
--
Bath
1,807
Sq Ft
$225/Sq Ft
Est. Value
About This Home
This home is located at 21724 Deacon Row, Forest Ranch, CA 95942 and is currently estimated at $405,682, approximately $224 per square foot. 21724 Deacon Row is a home.
Ownership History
Date
Name
Owned For
Owner Type
Purchase Details
Closed on
Dec 3, 2009
Sold by
Bertagna Bernard and Bertagna Mary Jane
Bought by
Bertagna Bernard N and Bertagna Mary Jane
Current Estimated Value
Purchase Details
Closed on
Feb 19, 2003
Sold by
Gilmore Joseph D and Gilmore Heidi R
Bought by
Bertagna Bernard
Purchase Details
Closed on
Nov 22, 1999
Sold by
Hart Garland and Hart Jeanie H
Bought by
Gilmore Joseph D and Gilmore Heidi R
Home Financials for this Owner
Home Financials are based on the most recent Mortgage that was taken out on this home.
Original Mortgage
$30,000
Interest Rate
7.82%
Mortgage Type
Seller Take Back
Purchase Details
Closed on
Feb 20, 1998
Sold by
Tseidlmayer Leo and Steildmayer Cynthia A
Bought by
Hart Garland and Hart Jeanie H
Home Financials for this Owner
Home Financials are based on the most recent Mortgage that was taken out on this home.
Original Mortgage
$60,000
Interest Rate
6.9%
Mortgage Type
Purchase Money Mortgage
Create a Home Valuation Report for This Property
The Home Valuation Report is an in-depth analysis detailing your home's value as well as a comparison with similar homes in the area
Home Values in the Area
Average Home Value in this Area
Purchase History
| Date | Buyer | Sale Price | Title Company |
|---|---|---|---|
| Bertagna Bernard N | -- | None Available | |
| Bertagna Bernard | $45,000 | Fidelity Natl Title Of Ca | |
| Gilmore Joseph D | $35,000 | Mid Valley Title & Escrow Co | |
| Hart Garland | $40,000 | Mid Valley Title & Escrow Co |
Source: Public Records
Mortgage History
| Date | Status | Borrower | Loan Amount |
|---|---|---|---|
| Previous Owner | Gilmore Joseph D | $30,000 | |
| Previous Owner | Hart Garland | $60,000 |
Source: Public Records
Tax History Compared to Growth
Tax History
| Year | Tax Paid | Tax Assessment Tax Assessment Total Assessment is a certain percentage of the fair market value that is determined by local assessors to be the total taxable value of land and additions on the property. | Land | Improvement |
|---|---|---|---|---|
| 2025 | $3,634 | $347,016 | $71,569 | $275,447 |
| 2024 | $3,634 | $340,213 | $70,166 | $270,047 |
| 2023 | $3,632 | $333,543 | $68,791 | $264,752 |
| 2022 | $3,564 | $327,004 | $67,443 | $259,561 |
| 2021 | $3,486 | $320,593 | $66,121 | $254,472 |
| 2020 | $3,312 | $317,307 | $65,444 | $251,863 |
| 2019 | $3,247 | $311,086 | $64,161 | $246,925 |
| 2018 | $3,184 | $304,987 | $62,903 | $242,084 |
| 2017 | $3,137 | $299,008 | $61,670 | $237,338 |
| 2016 | $3,000 | $293,146 | $60,461 | $232,685 |
| 2015 | -- | $288,743 | $59,553 | $229,190 |
| 2014 | -- | $283,088 | $58,387 | $224,701 |
Source: Public Records
Map
Nearby Homes
- 8002 Humboldt Rd
- 7952 Humboldt Rd
- 7851 Humboldt Rd
- 7528 Humboldt Rd
- 7404 Meadow Creek Dr
- 9002 Humboldt Rd
- 9478 Jones Creek Rd
- 1 Sky Ct
- 0 Batt Rd Unit ND25006483
- 17214 Manzanita St
- 17198 Skyway
- 17193 Manzanita St
- 17159 Manzanita St
- 17035 Manzanita St
- 0 Headwaters Rd
- 5625 Headwaters Rd
- 10 Roz Ln
- 200 Sleepy Valley Rd
- 15908 Skyway
- 6638 Ray Family Ln
- 8009 Humboldt Rd
- 8023 Humboldt Rd
- 21755 Deacon Row
- 21747 Deacons Row
- 7993 Humboldt Rd
- 21766 Deacon Row
- 21778 Deacon Row
- 7385 White Channel Ln
- 21782 Deacon Row
- 7985 Humboldt Rd
- 7845 White Channel Way
- 7986 Humboldt Rd
- 22054 Lucas Ranch Way
- 22076 Lucas Ranch Way
- 22022 Lucas Ranch Way
- 7960 Humboldt Rd
- 21896 Lucas Ranch Way
- 7949 Humboldt Rd
- 21995 Lucas Ranch Rd
- 21944 Lucas Ranch Rd