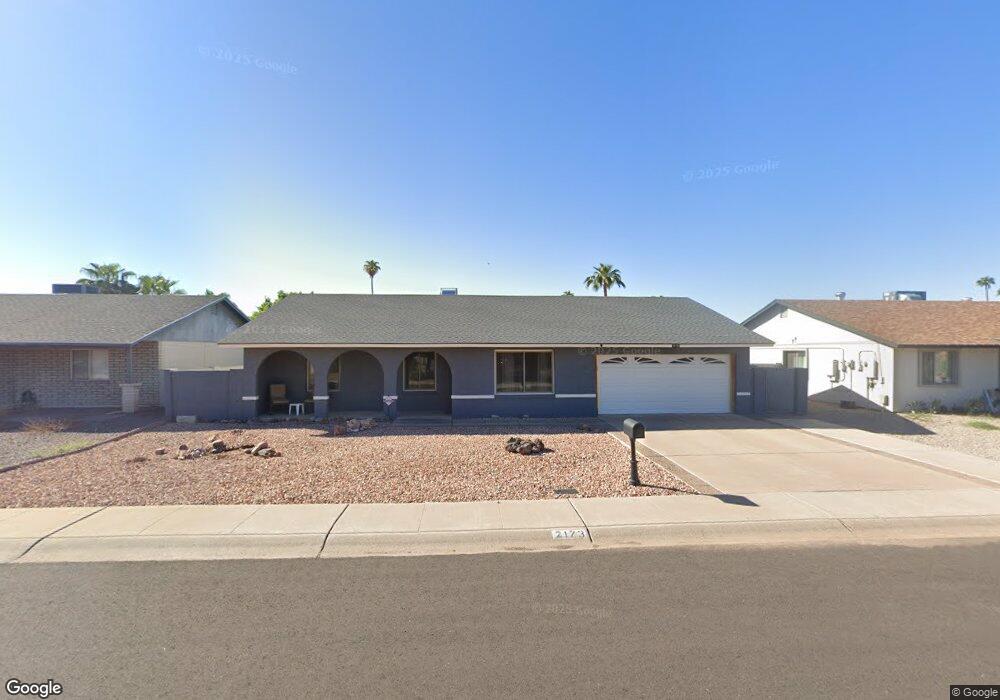
2173 E Apollo Ave Tempe, AZ 85283
The Lakes NeighborhoodEstimated Value: $418,461 - $556,000
Studio
2
Baths
1,670
Sq Ft
$295/Sq Ft
Est. Value
About This Home
This home is located at 2173 E Apollo Ave, Tempe, AZ 85283 and is currently estimated at $492,115, approximately $294 per square foot. 2173 E Apollo Ave is a home located in Maricopa County with nearby schools including Fuller Elementary School, Fees College Preparatory Middle School, and Marcos De Niza High School.
Ownership History
Date
Name
Owned For
Owner Type
Purchase Details
Closed on
Mar 25, 2008
Sold by
Mcmahon Kathleen
Bought by
Mcmahon Kathleen and Thurman Gerald
Current Estimated Value
Purchase Details
Closed on
May 20, 1998
Sold by
Mongovan David M
Bought by
Mcmahon Kathleen
Purchase Details
Closed on
Jun 22, 1995
Sold by
Hud
Bought by
Mongovan David M and Mcmahon Kathleen
Home Financials for this Owner
Home Financials are based on the most recent Mortgage that was taken out on this home.
Original Mortgage
$99,131
Interest Rate
7.92%
Mortgage Type
FHA
Purchase Details
Closed on
Feb 3, 1995
Sold by
Zions Mtg Company and Baker Karen L
Bought by
Zions Mtg Company
Purchase Details
Closed on
Nov 1, 1994
Sold by
Zions Mtg Company
Bought by
Hud
Create a Home Valuation Report for This Property
The Home Valuation Report is an in-depth analysis detailing your home's value as well as a comparison with similar homes in the area
Home Values in the Area
Average Home Value in this Area
Purchase History
| Date | Buyer | Sale Price | Title Company |
|---|---|---|---|
| Mcmahon Kathleen | -- | None Available | |
| Mcmahon Kathleen | -- | -- | |
| Mongovan David M | -- | -- | |
| Zions Mtg Company | -- | -- | |
| Hud | -- | -- |
Source: Public Records
Mortgage History
| Date | Status | Borrower | Loan Amount |
|---|---|---|---|
| Closed | Mongovan David M | $99,131 |
Source: Public Records
Tax History
| Year | Tax Paid | Tax Assessment Tax Assessment Total Assessment is a certain percentage of the fair market value that is determined by local assessors to be the total taxable value of land and additions on the property. | Land | Improvement |
|---|---|---|---|---|
| 2025 | $2,480 | $23,791 | -- | -- |
| 2024 | $2,276 | $22,658 | -- | -- |
| 2023 | $2,276 | $37,610 | $7,520 | $30,090 |
| 2022 | $2,173 | $27,400 | $5,480 | $21,920 |
| 2021 | $2,216 | $25,460 | $5,090 | $20,370 |
| 2020 | $2,143 | $23,920 | $4,780 | $19,140 |
| 2019 | $2,101 | $22,530 | $4,500 | $18,030 |
| 2018 | $2,045 | $20,500 | $4,100 | $16,400 |
| 2017 | $1,981 | $18,620 | $3,720 | $14,900 |
| 2016 | $1,972 | $18,330 | $3,660 | $14,670 |
| 2015 | $1,907 | $16,410 | $3,280 | $13,130 |
Source: Public Records
Map
Nearby Homes
- 5817 S Siesta Ln
- 2137 E Apollo Ave
- 2137 E Cornell Dr
- 2717 W Medina Ave
- 2401 S Saratoga
- 2628 W Mendoza Cir
- 2713 W Nido Ave
- 6320 S Shannon Dr Unit 9
- 2132 E Tulane Dr
- 2543 W Madero Ave
- 2041 E Radcliffe Dr
- 2260 S Estrella
- 5352 S Country Club Way
- 2030 E Colgate Dr
- 2232 S Don Carlos
- 2021 E Pegasus Dr
- 1919 E Auburn Dr
- 2517 W Lompoc Ave
- 2044 S Don Carlos Unit 7
- 2642 W Onza Ave
- 2169 E Apollo Ave
- 2177 E Apollo Ave
- 2169 E Apollo Ave
- 2164 E La Donna Dr Unit 8
- 2165 E Apollo Ave
- 2160 E La Donna Dr
- 2168 E La Donna Dr
- 2181 E Apollo Ave
- 2172 E Apollo Ave
- 2168 E Apollo Ave
- 2176 E Apollo Ave
- 2156 E La Donna Dr
- 2172 E La Donna Dr Unit 8
- 2164 E Apollo Ave
- 2161 E Apollo Ave
- 2180 E Apollo Ave
- 2152 E La Donna Dr
- 2160 E Apollo Ave
- 2163 E La Donna Dr
- 2175 E Sesame St
Your Personal Tour Guide
Ask me questions while you tour the home.