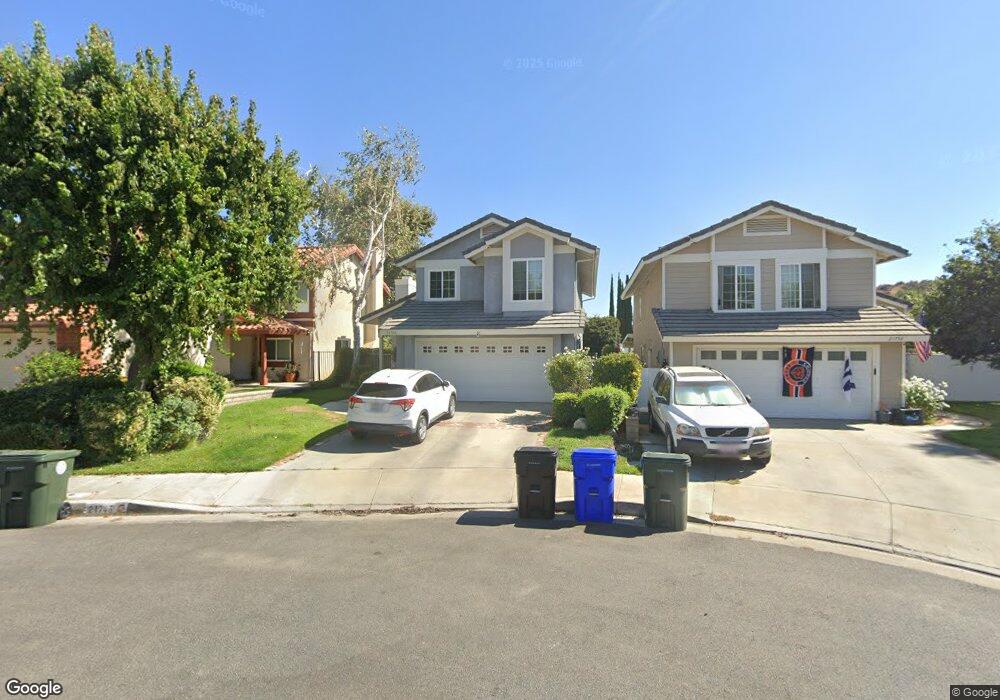
21748 Cheswold Ave Santa Clarita, CA 91350
Saugus NeighborhoodEstimated Value: $833,849 - $868,000
3
Beds
3
Baths
1,565
Sq Ft
$544/Sq Ft
Est. Value
About This Home
This home is located at 21748 Cheswold Ave, Santa Clarita, CA 91350 and is currently estimated at $850,962, approximately $543 per square foot. 21748 Cheswold Ave is a home located in Los Angeles County with nearby schools including Rosedell Elementary School, Arroyo Seco Junior High School, and Saugus High School.
Ownership History
Date
Name
Owned For
Owner Type
Purchase Details
Closed on
Mar 23, 2021
Sold by
Stevenson Trust
Bought by
Page Matthew and Koblin Whitney
Current Estimated Value
Home Financials for this Owner
Home Financials are based on the most recent Mortgage that was taken out on this home.
Original Mortgage
$606,825
Outstanding Balance
$546,701
Interest Rate
3%
Mortgage Type
New Conventional
Estimated Equity
$304,261
Purchase Details
Closed on
Aug 13, 2020
Sold by
Stevenson Craig R and Stevenson Kathleen H
Bought by
Stevenson Craig R and Stevenson Kathleen H
Purchase Details
Closed on
Feb 28, 1999
Sold by
Stevenson Craig R and The Stevenson Trust
Bought by
Stevenson Craig R and Stevenson Kathleen H
Home Financials for this Owner
Home Financials are based on the most recent Mortgage that was taken out on this home.
Original Mortgage
$157,500
Interest Rate
6.76%
Create a Home Valuation Report for This Property
The Home Valuation Report is an in-depth analysis detailing your home's value as well as a comparison with similar homes in the area
Home Values in the Area
Average Home Value in this Area
Purchase History
| Date | Buyer | Sale Price | Title Company |
|---|---|---|---|
| Page Matthew | $730,000 | Consumers Title | |
| Stevenson Craig R | -- | None Available | |
| Stevenson Craig R | -- | Gateway Title |
Source: Public Records
Mortgage History
| Date | Status | Borrower | Loan Amount |
|---|---|---|---|
| Open | Page Matthew | $606,825 | |
| Previous Owner | Stevenson Craig R | $157,500 |
Source: Public Records
Tax History Compared to Growth
Tax History
| Year | Tax Paid | Tax Assessment Tax Assessment Total Assessment is a certain percentage of the fair market value that is determined by local assessors to be the total taxable value of land and additions on the property. | Land | Improvement |
|---|---|---|---|---|
| 2025 | $10,120 | $790,172 | $452,455 | $337,717 |
| 2024 | $10,120 | $774,680 | $443,584 | $331,096 |
| 2023 | $9,875 | $759,491 | $434,887 | $324,604 |
| 2022 | $9,934 | $744,600 | $426,360 | $318,240 |
| 2021 | $4,031 | $267,230 | $105,731 | $161,499 |
| 2019 | $3,891 | $259,306 | $102,596 | $156,710 |
| 2018 | $3,786 | $254,223 | $100,585 | $153,638 |
| 2016 | $3,560 | $244,353 | $96,680 | $147,673 |
| 2015 | $3,428 | $240,683 | $95,228 | $145,455 |
| 2014 | $3,380 | $235,969 | $93,363 | $142,606 |
Source: Public Records
Map
Nearby Homes
- 21741 Jeffers Ln
- 28050 Devon Ln
- 28123 Bobwhite Cir Unit 104
- 21965 Jeffers Ln
- 21643 Masterson Ct
- 27632 Kevin Place
- 27610 Kevin Place
- 21929 Peppercorn Dr
- 21560 Quinn Place
- 28303 Sycamore Dr
- 21983 Centurion Way
- 22035 Conway Place
- 28340 Sycamore Dr
- 27619 Ron Ridge Dr
- 21558 Oak Dr Unit 78
- 27571 Caraway Ln
- 21553 Oak Dr Unit 115
- 22045 Milestone St
- 27829 Carnegie Ave
- 27547 Saffron Ln
- 21748 Cheswold Ln
- 21752 Cheswold Ln
- 21744 Cheswold Ave
- 21752 Cheswold Ave
- 21740 Cheswold Ave
- 21736 Cheswold Ave
- 28014 Caraway Ln
- 1 Bouquet
- 0 N Avail Unit F1789241
- 0 N Avail Unit F1789239
- 21732 Cheswold Ave
- 27997 Caraway Ln
- 27991 Caraway Ln
- 21743 Cheswold Ave
- 21745 Cheswold Ave
- 21749 Cheswold Ave
- 21737 Cheswold Ave
- 21728 Cheswold Ave
- 27987 Caraway Ln
- 28018 Caraway Ln