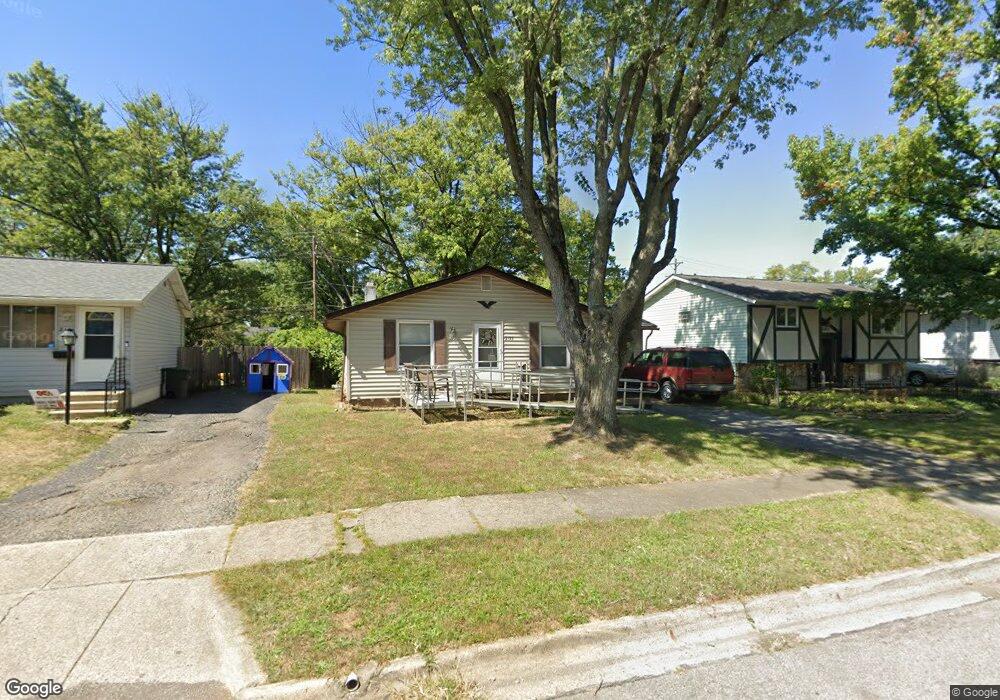
2175 Balford Square W Columbus, OH 43232
Glenbrook NeighborhoodEstimated Value: $151,000 - $201,000
3
Beds
1
Bath
896
Sq Ft
$201/Sq Ft
Est. Value
About This Home
This home is located at 2175 Balford Square W, Columbus, OH 43232 and is currently estimated at $179,911, approximately $200 per square foot. 2175 Balford Square W is a home located in Franklin County with nearby schools including Easthaven Elementary School, Yorktown Middle School, and Independence High School.
Ownership History
Date
Name
Owned For
Owner Type
Purchase Details
Closed on
Nov 5, 2003
Sold by
The Bank Of New York
Bought by
Longstreth Craig
Current Estimated Value
Purchase Details
Closed on
May 29, 2003
Sold by
White Robert L and Case #02Cve04 4429
Bought by
Bank Of New York and Eqcc Trust 2001-2
Purchase Details
Closed on
Dec 7, 2000
Sold by
Lewis Teresa A
Bought by
White Robert L
Home Financials for this Owner
Home Financials are based on the most recent Mortgage that was taken out on this home.
Original Mortgage
$73,625
Interest Rate
11.05%
Purchase Details
Closed on
Aug 31, 1993
Bought by
Lewis Teresa A
Purchase Details
Closed on
Dec 1, 1986
Purchase Details
Closed on
Jan 1, 1986
Create a Home Valuation Report for This Property
The Home Valuation Report is an in-depth analysis detailing your home's value as well as a comparison with similar homes in the area
Home Values in the Area
Average Home Value in this Area
Purchase History
| Date | Buyer | Sale Price | Title Company |
|---|---|---|---|
| Longstreth Craig | $59,000 | -- | |
| Bank Of New York | $65,000 | -- | |
| White Robert L | $77,500 | Titlequest Agency Inc | |
| Lewis Teresa A | $57,000 | -- | |
| -- | -- | -- | |
| -- | $38,500 | -- |
Source: Public Records
Mortgage History
| Date | Status | Borrower | Loan Amount |
|---|---|---|---|
| Previous Owner | White Robert L | $73,625 |
Source: Public Records
Tax History Compared to Growth
Tax History
| Year | Tax Paid | Tax Assessment Tax Assessment Total Assessment is a certain percentage of the fair market value that is determined by local assessors to be the total taxable value of land and additions on the property. | Land | Improvement |
|---|---|---|---|---|
| 2024 | $2,242 | $48,930 | $16,450 | $32,480 |
| 2023 | $2,214 | $48,930 | $16,450 | $32,480 |
| 2022 | $1,001 | $18,840 | $6,340 | $12,500 |
| 2021 | $1,003 | $18,840 | $6,340 | $12,500 |
| 2020 | $1,005 | $18,840 | $6,340 | $12,500 |
| 2019 | $897 | $14,430 | $5,080 | $9,350 |
| 2018 | $1,048 | $14,430 | $5,080 | $9,350 |
| 2017 | $897 | $14,430 | $5,080 | $9,350 |
| 2016 | $1,317 | $19,390 | $4,410 | $14,980 |
| 2015 | $1,199 | $19,390 | $4,410 | $14,980 |
| 2014 | $1,202 | $19,390 | $4,410 | $14,980 |
| 2013 | $624 | $20,405 | $4,655 | $15,750 |
Source: Public Records
Map
Nearby Homes
- 2252 Meridian Ct
- 2275 Cardston Ct
- 3365 Bruceton Ave
- 3054 Wadsworth Ct
- 3038 Wadsworth Ct
- 3036 Wadsworth Ct
- 2425 Mason Village Ct Unit 2425
- 1836 Penfield Ct S
- 0 Ravenswood Ct
- 3325 E Deshler Ave
- 2971 Queensrowe Dr
- 3830 Charbonnett Ct Unit 6-A
- 1664 Barnett Rd
- 3246 E Deshler Ave
- 2472 Nassau Dr Unit 37D
- 1624 Miltwood Rd
- 1782 Newfield Rd
- 2509 Burgandy Ln Unit 46B
- 2503 Burgandy Ln Unit 46A
- 1767 Alcoy Dr
- 2167 Balford Square W
- 2181 Balford Square W
- 2161 Balford Square W
- 2187 Balford Square W
- 2168 Glenbrook Dr
- 2176 Glenbrook Dr
- 2160 Glenbrook Dr
- 2155 Balford Square W
- 2176 Balford Square W
- 2184 Glenbrook Dr
- 2168 Balford Square W
- 3318 Balford Square S
- 3303 Balford Square S
- 2149 Balford Square W
- 2160 Balford Square W
- 2144 Glenbrook Dr
- 3309 Balford Square S
- 2154 Balford Square W
- 2141 Balford Square W