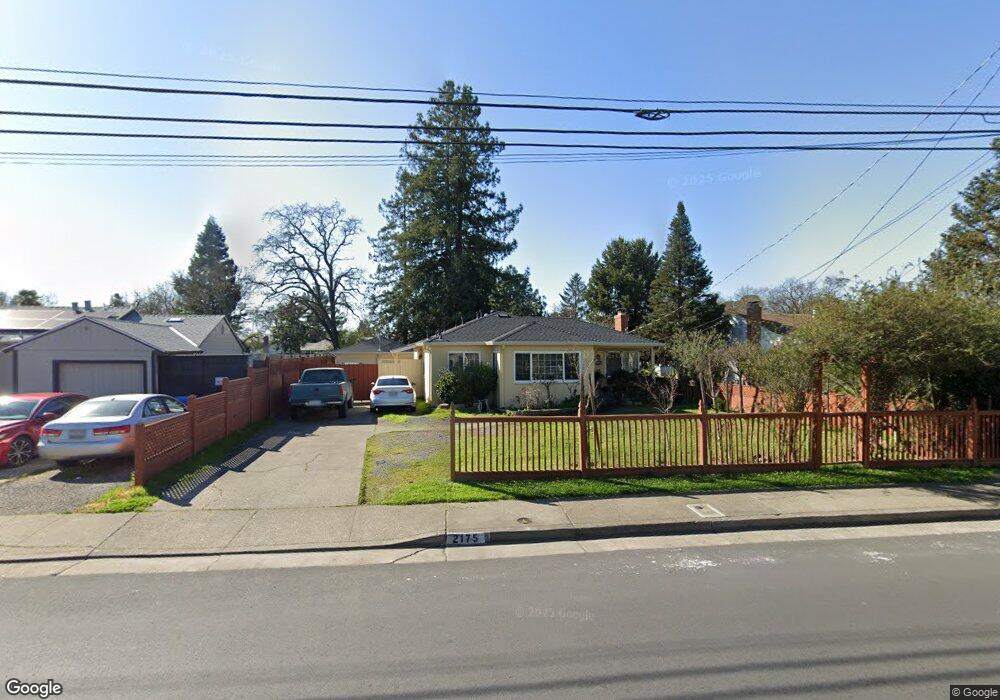
2175 Dutton Ave Santa Rosa, CA 95407
Roseland NeighborhoodEstimated Value: $585,000 - $638,838
3
Beds
1
Bath
1,371
Sq Ft
$441/Sq Ft
Est. Value
About This Home
This home is located at 2175 Dutton Ave, Santa Rosa, CA 95407 and is currently estimated at $605,210, approximately $441 per square foot. 2175 Dutton Ave is a home located in Sonoma County with nearby schools including Elsie Allen High School and St. Michael's Orthodox School.
Ownership History
Date
Name
Owned For
Owner Type
Purchase Details
Closed on
Aug 25, 2020
Sold by
Recillas Noe Calderon and Calderon Luz
Bought by
Recillas Noe Calderon and Calderon Luz
Current Estimated Value
Home Financials for this Owner
Home Financials are based on the most recent Mortgage that was taken out on this home.
Original Mortgage
$353,000
Outstanding Balance
$313,264
Interest Rate
2.9%
Mortgage Type
New Conventional
Estimated Equity
$291,946
Purchase Details
Closed on
May 2, 2000
Sold by
Caviglia Rose Est Of and Angela L
Bought by
Calderon Noe and Rivas Luz
Home Financials for this Owner
Home Financials are based on the most recent Mortgage that was taken out on this home.
Original Mortgage
$213,400
Interest Rate
8.25%
Purchase Details
Closed on
Jul 10, 1998
Sold by
Caviglia Rose
Bought by
Caviglia Rose and Rose Caviglia 1998 Revocable L
Create a Home Valuation Report for This Property
The Home Valuation Report is an in-depth analysis detailing your home's value as well as a comparison with similar homes in the area
Home Values in the Area
Average Home Value in this Area
Purchase History
| Date | Buyer | Sale Price | Title Company |
|---|---|---|---|
| Recillas Noe Calderon | -- | Fidelity National Title Co | |
| Calderon Noe | $242,500 | Fidelity National Title Co | |
| Caviglia Rose | -- | -- |
Source: Public Records
Mortgage History
| Date | Status | Borrower | Loan Amount |
|---|---|---|---|
| Open | Recillas Noe Calderon | $353,000 | |
| Closed | Calderon Noe | $213,400 |
Source: Public Records
Tax History
| Year | Tax Paid | Tax Assessment Tax Assessment Total Assessment is a certain percentage of the fair market value that is determined by local assessors to be the total taxable value of land and additions on the property. | Land | Improvement |
|---|---|---|---|---|
| 2025 | $5,704 | $372,705 | $138,316 | $234,389 |
| 2024 | $5,704 | $365,398 | $135,604 | $229,794 |
| 2023 | $5,704 | $358,235 | $132,946 | $225,289 |
| 2022 | $5,847 | $351,212 | $130,340 | $220,872 |
| 2021 | $6,219 | $344,327 | $127,785 | $216,542 |
| 2020 | $5,935 | $340,797 | $126,475 | $214,322 |
| 2019 | $5,544 | $334,116 | $123,996 | $210,120 |
| 2018 | $5,267 | $327,565 | $121,565 | $206,000 |
| 2017 | $4,787 | $321,143 | $119,182 | $201,961 |
| 2016 | $4,705 | $314,847 | $116,846 | $198,001 |
| 2015 | $4,554 | $310,118 | $115,091 | $195,027 |
| 2014 | $4,404 | $304,044 | $112,837 | $191,207 |
Source: Public Records
Map
Nearby Homes
- 919 Naify Ln
- 1964 Las Ventanas Dr
- 1962 Las Ventanas Dr
- 2424 Kenton Ct
- 1704 Dutton Ave
- 1630 Mathwig Dr
- 487 Hearn Ave
- 2721 Victoria Dr
- 0 West Ave Unit 325019616
- 1863 Beachwood Dr
- 101 Colgan Ave Unit 25
- 101 Colgan Ave Unit 24
- 101 Colgan Ave Unit 2
- 2302 Squire Ln Unit 40
- 1461 Trombetta St
- 2622 Arrowhead Dr
- 780 Dutton Ave
- 109 Pear Ln Unit 109
- 70 Birch Haven Way
- 190 Apple Ln
Your Personal Tour Guide
Ask me questions while you tour the home.