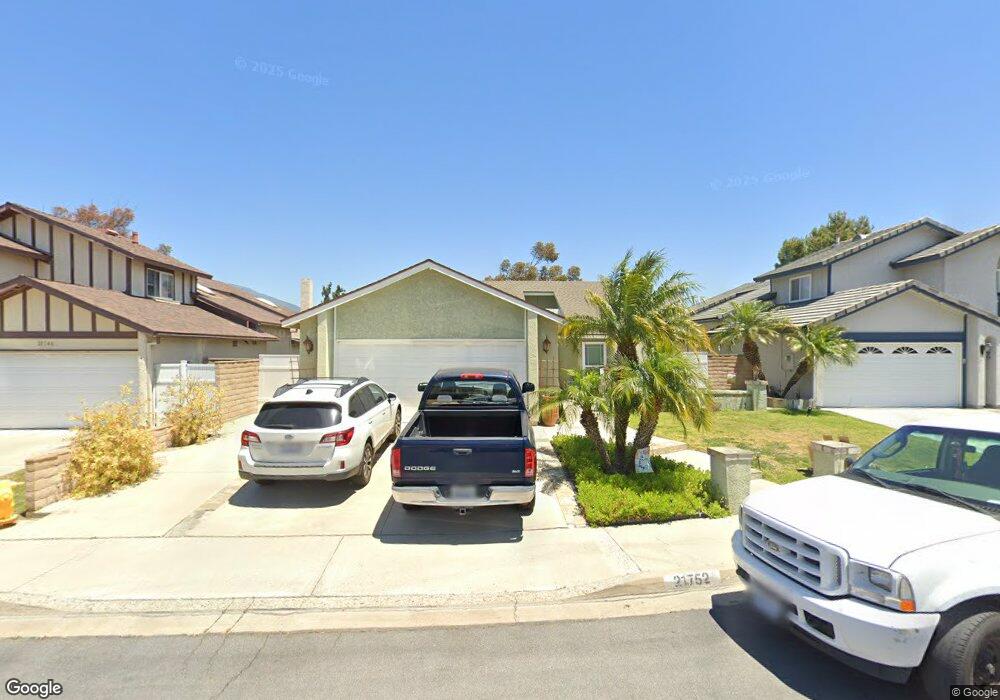
21752 Cabrosa Mission Viejo, CA 92691
Estimated Value: $1,099,000 - $1,181,000
3
Beds
2
Baths
1,561
Sq Ft
$738/Sq Ft
Est. Value
About This Home
This home is located at 21752 Cabrosa, Mission Viejo, CA 92691 and is currently estimated at $1,151,524, approximately $737 per square foot. 21752 Cabrosa is a home located in Orange County with nearby schools including Del Lago Elementary School, Los Alisos Intermediate School, and Trabuco Hills High School.
Ownership History
Date
Name
Owned For
Owner Type
Purchase Details
Closed on
Dec 19, 2018
Sold by
Slauzis Brian W and Slauzis Kimberly A
Bought by
Slauzis Brian W and Slauzis Kimberly A
Current Estimated Value
Purchase Details
Closed on
Jun 11, 1999
Sold by
Ball Samuel J and Ball Korri S
Bought by
Slauzis Brian W and Slauzis Kimberly A
Home Financials for this Owner
Home Financials are based on the most recent Mortgage that was taken out on this home.
Original Mortgage
$212,800
Outstanding Balance
$57,744
Interest Rate
7.4%
Estimated Equity
$1,093,780
Purchase Details
Closed on
Oct 12, 1998
Sold by
Lukin John D and Lukin Diana L
Bought by
Ball Samuel J and Ball Korri S
Home Financials for this Owner
Home Financials are based on the most recent Mortgage that was taken out on this home.
Original Mortgage
$220,000
Interest Rate
4.62%
Create a Home Valuation Report for This Property
The Home Valuation Report is an in-depth analysis detailing your home's value as well as a comparison with similar homes in the area
Home Values in the Area
Average Home Value in this Area
Purchase History
| Date | Buyer | Sale Price | Title Company |
|---|---|---|---|
| Slauzis Brian W | -- | None Available | |
| Slauzis Brian W | $266,000 | Chicago Title Co | |
| Ball Samuel J | $245,000 | Orange Coast Title |
Source: Public Records
Mortgage History
| Date | Status | Borrower | Loan Amount |
|---|---|---|---|
| Open | Slauzis Brian W | $212,800 | |
| Previous Owner | Ball Samuel J | $220,000 | |
| Closed | Slauzis Brian W | $26,600 |
Source: Public Records
Tax History Compared to Growth
Tax History
| Year | Tax Paid | Tax Assessment Tax Assessment Total Assessment is a certain percentage of the fair market value that is determined by local assessors to be the total taxable value of land and additions on the property. | Land | Improvement |
|---|---|---|---|---|
| 2025 | $4,070 | $408,827 | $269,004 | $139,823 |
| 2024 | $4,070 | $400,811 | $263,729 | $137,082 |
| 2023 | $3,972 | $392,952 | $258,557 | $134,395 |
| 2022 | $3,900 | $385,248 | $253,488 | $131,760 |
| 2021 | $3,821 | $377,695 | $248,518 | $129,177 |
| 2020 | $3,786 | $373,823 | $245,970 | $127,853 |
| 2019 | $3,710 | $366,494 | $241,147 | $125,347 |
| 2018 | $3,639 | $359,308 | $236,418 | $122,890 |
| 2017 | $3,565 | $352,263 | $231,782 | $120,481 |
| 2016 | $3,505 | $345,356 | $227,237 | $118,119 |
| 2015 | $3,478 | $340,169 | $223,824 | $116,345 |
| 2014 | $3,402 | $333,506 | $219,440 | $114,066 |
Source: Public Records
Map
Nearby Homes
- 21691 Cabrosa
- 21881 Bacalar
- 21671 Fernbrook Unit 186
- 21795 Tobarra
- 22068 Antigua
- 28242 Elmwood
- 27982 Virginia
- 28052 Virginia
- 21722 Fairbrook Unit 45
- 21981 Birchwood
- 28111 Virginia
- 27691 Alarcon
- 21262 Bristlecone
- 27436 Sereno
- 21755 Herencia
- 21902 Herencia
- 22402 Valdemosa Unit 19
- 22422 Porreras Unit 7
- 21175 Tangerine Unit 119
- 27837 Violet Unit 152