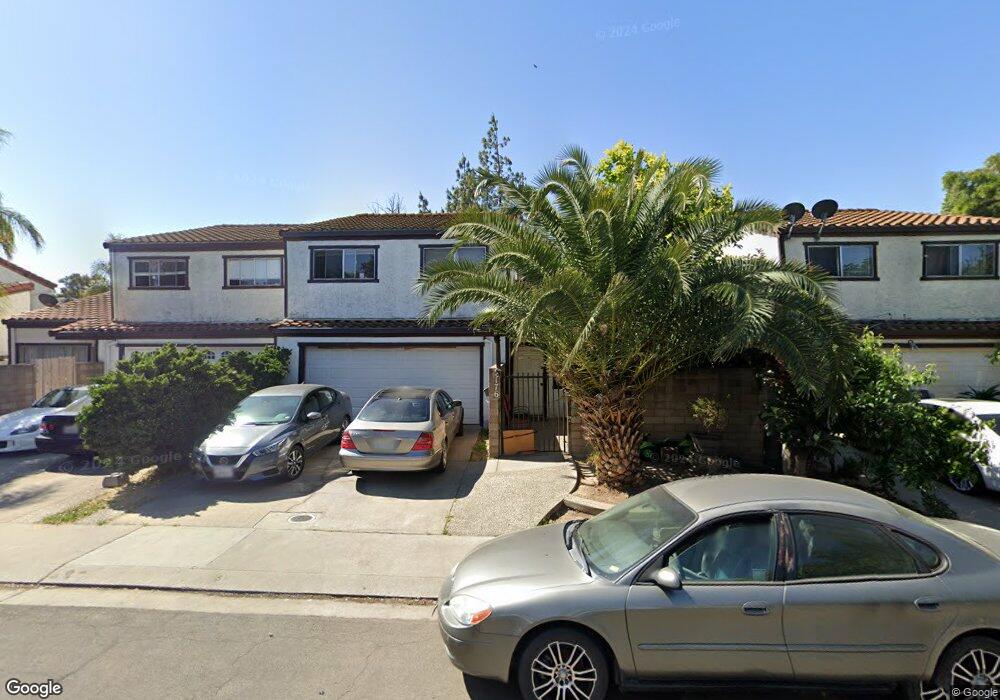
2176 Jason Way Modesto, CA 95350
Estimated Value: $299,000 - $367,204
3
Beds
3
Baths
1,428
Sq Ft
$234/Sq Ft
Est. Value
About This Home
This home is located at 2176 Jason Way, Modesto, CA 95350 and is currently estimated at $334,301, approximately $234 per square foot. 2176 Jason Way is a home located in Stanislaus County with nearby schools including Josephine Chrysler Elementary School, Prescott Junior High School, and Grace M. Davis High School.
Ownership History
Date
Name
Owned For
Owner Type
Purchase Details
Closed on
Nov 16, 2005
Sold by
Nguyen Trong T and Tran Bao Q
Bought by
Tran Cindy and Tran Bao Q
Current Estimated Value
Purchase Details
Closed on
Apr 17, 2002
Sold by
Tran Cuong Quoc
Bought by
Nguyen Trong T
Home Financials for this Owner
Home Financials are based on the most recent Mortgage that was taken out on this home.
Original Mortgage
$101,500
Interest Rate
6.87%
Purchase Details
Closed on
Mar 19, 2002
Sold by
Holman Harold and Holman Jacqueline
Bought by
Nguyen Trong T and Tran Bao Q
Home Financials for this Owner
Home Financials are based on the most recent Mortgage that was taken out on this home.
Original Mortgage
$101,500
Interest Rate
6.87%
Purchase Details
Closed on
Aug 19, 1998
Sold by
Holman Harold B and Holman Jacqueline
Bought by
Holman Harold and Holman Jacqueline
Create a Home Valuation Report for This Property
The Home Valuation Report is an in-depth analysis detailing your home's value as well as a comparison with similar homes in the area
Purchase History
| Date | Buyer | Sale Price | Title Company |
|---|---|---|---|
| Tran Cindy | -- | -- | |
| Nguyen Trong T | -- | Fidelity National Title Co | |
| Nguyen Trong T | $127,000 | Fidelity National Title Co | |
| Holman Harold | -- | -- |
Source: Public Records
Mortgage History
| Date | Status | Borrower | Loan Amount |
|---|---|---|---|
| Closed | Nguyen Trong T | $101,500 |
Source: Public Records
Tax History
| Year | Tax Paid | Tax Assessment Tax Assessment Total Assessment is a certain percentage of the fair market value that is determined by local assessors to be the total taxable value of land and additions on the property. | Land | Improvement |
|---|---|---|---|---|
| 2025 | $2,163 | $187,594 | $44,306 | $143,288 |
| 2024 | $2,086 | $183,917 | $43,438 | $140,479 |
| 2023 | $2,048 | $180,312 | $42,587 | $137,725 |
| 2022 | $1,992 | $176,777 | $41,752 | $135,025 |
| 2021 | $1,883 | $173,312 | $40,934 | $132,378 |
| 2020 | $1,858 | $171,536 | $40,515 | $131,021 |
| 2019 | $1,836 | $168,173 | $39,721 | $128,452 |
| 2018 | $1,814 | $164,877 | $38,943 | $125,934 |
| 2017 | $1,772 | $161,645 | $38,180 | $123,465 |
| 2016 | $1,725 | $158,477 | $37,432 | $121,045 |
| 2015 | $1,529 | $139,500 | $22,000 | $117,500 |
| 2014 | $1,405 | $127,000 | $20,000 | $107,000 |
Source: Public Records
Map
Nearby Homes
- 2165 Sharon Way
- 2104 Sharon Way
- 2116 Mount Vernon Dr Unit C
- 2212 Palisade Ave
- 2041 Wally Ct
- 2052 Juanita Ct
- 2137 Chrysler Dr
- 2501 Prescott Rd
- 2312 St James Place
- 2134 Whitcomb Way
- 1908 Debonaire Ct
- 2800 Prescott Rd
- 2621 Prescott Rd Unit 189
- 2621 Prescott Rd Unit 79
- 2621 Prescott Rd Unit 17
- 2621 Prescott Rd Unit 277
- 2621 Prescott Rd Unit 262
- 2621 Prescott Rd Unit 37
- 2621 Prescott Rd Unit 40
- 2621 Prescott Rd Unit 92
- 2200 Jason Way
- 2204 Jason Way
- 2168 Jason Way
- 2208 Jason Way
- 2164 Jason Way
- 2173 Jason Way
- 2177 Jason Way
- 2169 Jason Way
- 2201 Jason Way
- 2165 Jason Way
- 2212 Jason Way
- 2160 Jason Way
- 2205 Jason Way
- 2161 Jason Way
- 2209 Jason Way
- 2172 Sharon Way
- 2216 Jason Way
- 2156 Jason Way
- 2176 Sharon Way
- 2168 Sharon Way
Your Personal Tour Guide
Ask me questions while you tour the home.