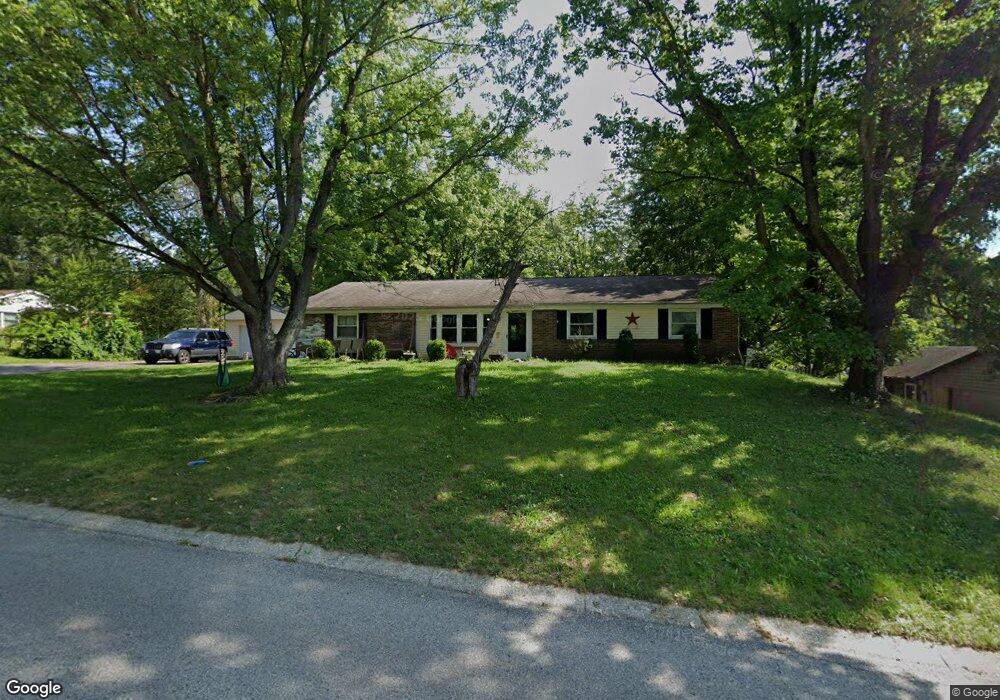
2176 Regent Park Dr Bellbrook, OH 45305
Estimated Value: $284,422 - $322,000
3
Beds
2
Baths
1,542
Sq Ft
$195/Sq Ft
Est. Value
About This Home
This home is located at 2176 Regent Park Dr, Bellbrook, OH 45305 and is currently estimated at $301,106, approximately $195 per square foot. 2176 Regent Park Dr is a home located in Greene County with nearby schools including Stephen Bell Elementary School, Bell Creek Intermediate School, and Bellbrook Middle School.
Ownership History
Date
Name
Owned For
Owner Type
Purchase Details
Closed on
May 13, 2016
Sold by
Schweikert Janet M
Bought by
Grimes Stephanie and Grimes Stephen
Current Estimated Value
Home Financials for this Owner
Home Financials are based on the most recent Mortgage that was taken out on this home.
Original Mortgage
$145,900
Outstanding Balance
$118,508
Interest Rate
3.58%
Mortgage Type
USDA
Estimated Equity
$182,598
Purchase Details
Closed on
Aug 21, 2012
Sold by
Hensley Douglas L
Bought by
Schweikert Janet M
Home Financials for this Owner
Home Financials are based on the most recent Mortgage that was taken out on this home.
Original Mortgage
$117,655
Interest Rate
3.48%
Mortgage Type
Unknown
Purchase Details
Closed on
Aug 22, 2000
Sold by
Hensley Roy and Hensley Marilyn J
Bought by
Hensley Roy and Hensley Marilyn J
Create a Home Valuation Report for This Property
The Home Valuation Report is an in-depth analysis detailing your home's value as well as a comparison with similar homes in the area
Home Values in the Area
Average Home Value in this Area
Purchase History
| Date | Buyer | Sale Price | Title Company |
|---|---|---|---|
| Grimes Stephanie | $145,900 | None Available | |
| Schweikert Janet M | $124,900 | None Available | |
| Hensley Roy | -- | -- |
Source: Public Records
Mortgage History
| Date | Status | Borrower | Loan Amount |
|---|---|---|---|
| Open | Grimes Stephanie | $145,900 | |
| Closed | Schweikert Janet M | $117,655 |
Source: Public Records
Tax History
| Year | Tax Paid | Tax Assessment Tax Assessment Total Assessment is a certain percentage of the fair market value that is determined by local assessors to be the total taxable value of land and additions on the property. | Land | Improvement |
|---|---|---|---|---|
| 2025 | $4,308 | $73,750 | $15,880 | $57,870 |
| 2024 | $4,308 | $73,750 | $15,880 | $57,870 |
| 2023 | $4,146 | $73,750 | $15,880 | $57,870 |
| 2022 | $3,816 | $55,380 | $12,700 | $42,680 |
| 2021 | $3,855 | $55,380 | $12,700 | $42,680 |
| 2020 | $3,603 | $55,380 | $12,700 | $42,680 |
| 2019 | $3,467 | $48,420 | $10,860 | $37,560 |
| 2018 | $3,469 | $48,420 | $10,860 | $37,560 |
| 2017 | $3,301 | $48,420 | $10,860 | $37,560 |
| 2016 | $3,342 | $45,110 | $10,860 | $34,250 |
| 2015 | $3,352 | $45,110 | $10,860 | $34,250 |
| 2014 | $3,114 | $45,110 | $10,860 | $34,250 |
Source: Public Records
Map
Nearby Homes
- 2085 Regent Park Dr
- 2214 Hillrise Cir
- 4096 Woodedge Dr
- 2016 Wentworth Village Dr Unit 2016
- 4102 Ridgetop Dr
- 2415 Tennyson Dr
- 3938 Liam Ct
- 2215 S Linda Dr
- 2213 S Lakeman Dr
- 1860 Bledsoe Dr
- 42 Deerpath Cir
- 1667 Ardennes Oak Dr
- 3617 Shellbark Dr
- 3553 Shellbark Dr
- 45 N East St Unit 45
- 2219 Bradley Ct
- 3634 Marwood Dr
- 2187 Tampico Trail
- 2193 Tampico Trail
- 208 Pinegrove Dr
- 2182 Regent Park Dr
- 2168 Regent Park Dr
- 3925 Kim Ct
- 3933 Kim Ct
- 2184 Shadowood Cir
- 2188 Regent Park Dr
- 2187 Regent Park Dr
- 2179 Shadowood Cir
- 2165 Regent Park Dr
- 2239 VeMcO Dr
- 2193 Regent Park Dr
- 2155 Dane Ln
- 2196 Shadowood Cir
- 3936 Kim Ct
- 2191 Shadowood Cir
- 2173 Firebird Dr
- 2159 Firebird Dr
- 2195 Regent Park Dr
- 2206 Shadowood Cir
- 2139 Dane Ln
Your Personal Tour Guide
Ask me questions while you tour the home.