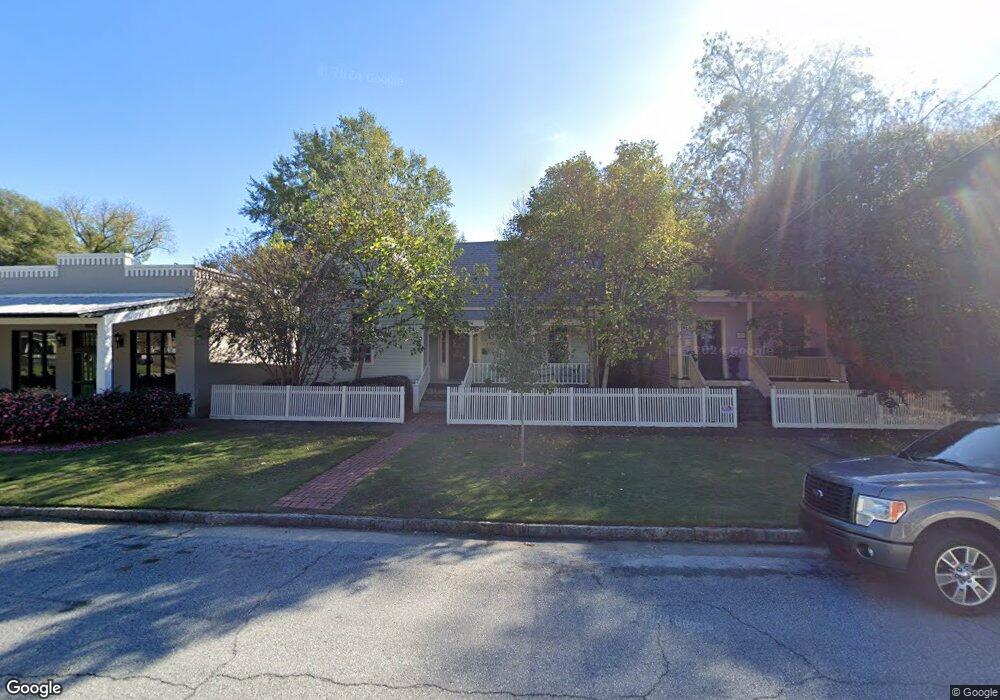
218 7th St Columbus, GA 31901
Downtown Columbus NeighborhoodEstimated Value: $238,000 - $306,000
2
Beds
2
Baths
1,576
Sq Ft
$177/Sq Ft
Est. Value
About This Home
This home is located at 218 7th St, Columbus, GA 31901 and is currently estimated at $278,502, approximately $176 per square foot. 218 7th St is a home with nearby schools including Davis Elementary School, Eddy Middle School, and Jordan Vocational High School.
Ownership History
Date
Name
Owned For
Owner Type
Purchase Details
Closed on
Jan 14, 2019
Sold by
Elk River Llc
Bought by
Dunphy Joseph
Current Estimated Value
Home Financials for this Owner
Home Financials are based on the most recent Mortgage that was taken out on this home.
Original Mortgage
$105,000
Outstanding Balance
$92,316
Interest Rate
4.6%
Mortgage Type
New Conventional
Estimated Equity
$186,186
Purchase Details
Closed on
Dec 20, 2017
Sold by
Milligan Michael D
Bought by
Elk River Llc
Home Financials for this Owner
Home Financials are based on the most recent Mortgage that was taken out on this home.
Original Mortgage
$109,650
Interest Rate
3.92%
Mortgage Type
New Conventional
Purchase Details
Closed on
Jun 5, 2014
Sold by
Pound Murphey Garrett
Bought by
Milligan Michael D
Create a Home Valuation Report for This Property
The Home Valuation Report is an in-depth analysis detailing your home's value as well as a comparison with similar homes in the area
Home Values in the Area
Average Home Value in this Area
Purchase History
We collect this data history from publicly available records. To have your information removed, we recommend requesting removal directly through your county’s website.
| Date | Buyer | Sale Price | Title Company |
|---|---|---|---|
| Dunphy Joseph | -- | -- | |
| Elk River Llc | $129,000 | -- | |
| Milligan Michael D | $140,000 | -- |
Source: Public Records
Mortgage History
We collect this data history from publicly available records. To have your information removed, we recommend requesting removal directly through your county’s website.
| Date | Status | Borrower | Loan Amount |
|---|---|---|---|
| Open | Dunphy Joseph | $105,000 | |
| Previous Owner | Elk River Llc | $109,650 |
Source: Public Records
Tax History
| Year | Tax Paid | Tax Assessment Tax Assessment Total Assessment is a certain percentage of the fair market value that is determined by local assessors to be the total taxable value of land and additions on the property. | Land | Improvement |
|---|---|---|---|---|
| 2025 | $3,844 | $98,188 | $18,508 | $79,680 |
| 2024 | $3,267 | $98,188 | $18,508 | $79,680 |
| 2023 | $3,750 | $95,196 | $18,508 | $76,688 |
| 2022 | $2,799 | $68,548 | $7,140 | $61,408 |
| 2021 | $2,107 | $51,600 | $7,020 | $44,580 |
| 2020 | $2,107 | $51,600 | $7,020 | $44,580 |
| 2019 | $1,828 | $52,484 | $14,820 | $37,664 |
| 2018 | $2,114 | $51,600 | $14,560 | $37,040 |
| 2017 | $2,169 | $52,484 | $14,820 | $37,664 |
| 2016 | $2,310 | $56,000 | $6,586 | $49,414 |
| 2015 | $925 | $56,000 | $6,586 | $49,414 |
| 2014 | $732 | $44,228 | $6,586 | $37,642 |
| 2013 | -- | $44,228 | $6,586 | $37,642 |
Source: Public Records
Map
Nearby Homes
Your Personal Tour Guide
Ask me questions while you tour the home.