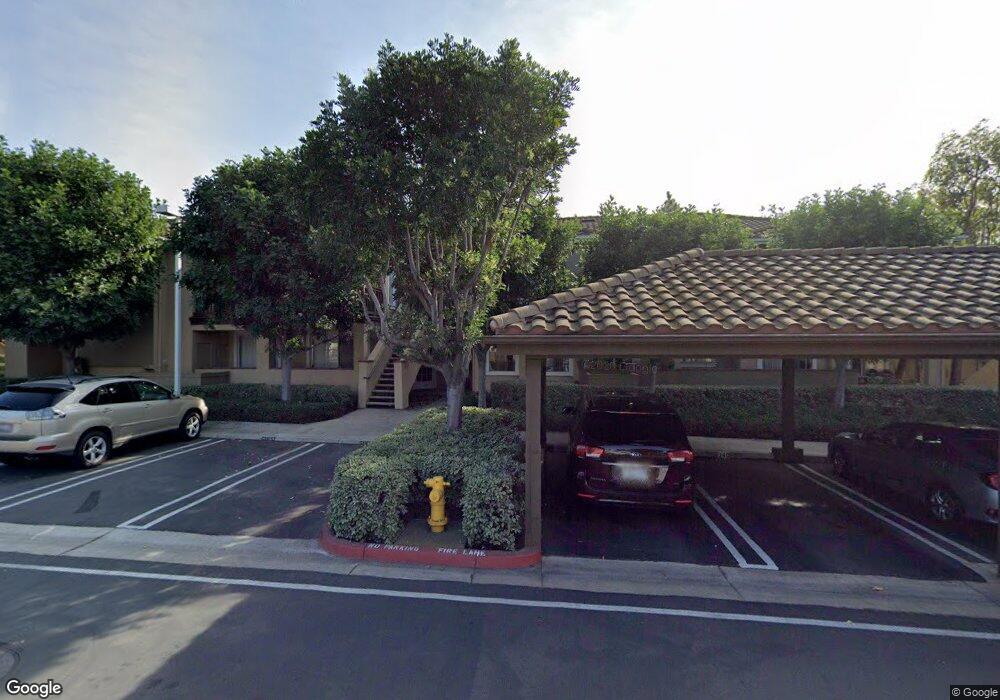
218 Gallery Way Unit 152 Tustin, CA 92782
Tustin Ranch NeighborhoodEstimated Value: $711,247 - $802,000
2
Beds
2
Baths
910
Sq Ft
$822/Sq Ft
Est. Value
About This Home
This home is located at 218 Gallery Way Unit 152, Tustin, CA 92782 and is currently estimated at $747,812, approximately $821 per square foot. 218 Gallery Way Unit 152 is a home located in Orange County with nearby schools including Ladera Elementary School, Pioneer Middle School, and Arnold O. Beckman High School.
Ownership History
Date
Name
Owned For
Owner Type
Purchase Details
Closed on
Apr 6, 2003
Sold by
Vitarelli Pamela W
Bought by
Foroughi Minoo
Current Estimated Value
Home Financials for this Owner
Home Financials are based on the most recent Mortgage that was taken out on this home.
Original Mortgage
$235,900
Interest Rate
5.75%
Mortgage Type
Purchase Money Mortgage
Purchase Details
Closed on
Sep 9, 1997
Sold by
Tajudin Amat K and Tajudin Mary R
Bought by
Vitarelli Pamela W
Home Financials for this Owner
Home Financials are based on the most recent Mortgage that was taken out on this home.
Original Mortgage
$127,256
Interest Rate
7.36%
Mortgage Type
FHA
Create a Home Valuation Report for This Property
The Home Valuation Report is an in-depth analysis detailing your home's value as well as a comparison with similar homes in the area
Home Values in the Area
Average Home Value in this Area
Purchase History
| Date | Buyer | Sale Price | Title Company |
|---|---|---|---|
| Foroughi Minoo | $295,000 | Equity Title Company | |
| Vitarelli Pamela W | $132,500 | First American Title Ins Co |
Source: Public Records
Mortgage History
| Date | Status | Borrower | Loan Amount |
|---|---|---|---|
| Previous Owner | Foroughi Minoo | $235,900 | |
| Previous Owner | Vitarelli Pamela W | $127,256 |
Source: Public Records
Tax History
| Year | Tax Paid | Tax Assessment Tax Assessment Total Assessment is a certain percentage of the fair market value that is determined by local assessors to be the total taxable value of land and additions on the property. | Land | Improvement |
|---|---|---|---|---|
| 2025 | $4,387 | $427,102 | $301,956 | $125,146 |
| 2024 | $4,387 | $418,728 | $296,035 | $122,693 |
| 2023 | $4,286 | $410,518 | $290,230 | $120,288 |
| 2022 | $4,660 | $402,469 | $284,539 | $117,930 |
| 2021 | $4,554 | $394,578 | $278,960 | $115,618 |
| 2020 | $4,491 | $390,533 | $276,100 | $114,433 |
| 2019 | $4,403 | $382,876 | $270,686 | $112,190 |
| 2018 | $4,307 | $375,369 | $265,378 | $109,991 |
| 2017 | $4,185 | $368,009 | $260,174 | $107,835 |
| 2016 | $4,107 | $360,794 | $255,073 | $105,721 |
| 2015 | $4,059 | $355,375 | $251,242 | $104,133 |
| 2014 | $4,005 | $348,414 | $246,320 | $102,094 |
Source: Public Records
Map
Nearby Homes
- 234 Gallery Way Unit 163
- 2605 Augusta
- 12095 Morrow Dr
- 12257 Pevero
- 2960 Champion Way Unit 1407
- 11755 Collar Ave
- 2827 Player Ln
- 2894 Player Ln
- 12581 Doral Unit 54
- 2920 Player Ln Unit 1
- 2346 Tryall Unit 78
- 50 Linhaven
- 59 Boulder Creek Way
- 2121 Valhalla Dr
- 2011 Redberry Rd
- 33 Winterfield Rd
- 12261 Browning Ave
- 14 Sorenson
- 12605 Prescott Ave
- 12665 Stanton Ave
- 160 Gallery Way Unit 134
- 219 Gallery Way Unit 219
- 161 Gallery Way Unit 122
- 164 Gallery Way
- 158 Gallery Way Unit 133
- 217 Gallery Way
- 162 Gallery Way
- 159 Gallery Way
- 165 Gallery Way Unit 126
- 220 Gallery Way
- 155 Gallery Way Unit 129
- 214 Gallery Way
- 157 Gallery Way Unit 131
- 211 Gallery Way
- 213 Gallery Way
- 163 Gallery Way
- 156 Gallery Way Unit 130
- 154 Gallery Way
- 205 Gallery Way
- 166 Gallery Way
Your Personal Tour Guide
Ask me questions while you tour the home.