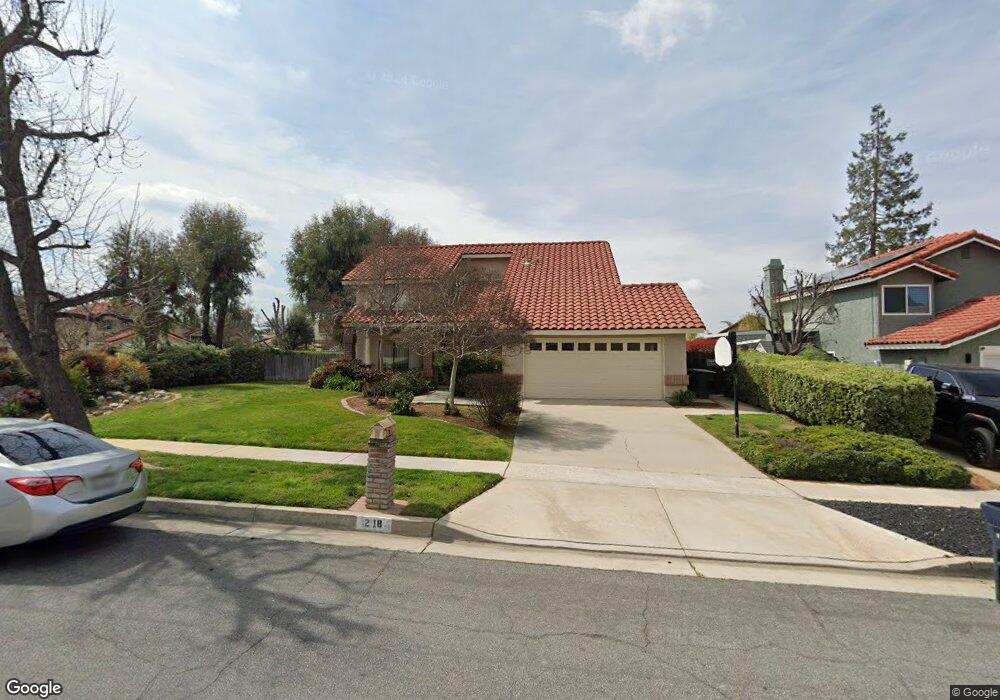
218 Jesse Way Redlands, CA 92374
South Redlands NeighborhoodEstimated Value: $698,478 - $740,000
4
Beds
3
Baths
2,022
Sq Ft
$355/Sq Ft
Est. Value
About This Home
This home is located at 218 Jesse Way, Redlands, CA 92374 and is currently estimated at $718,370, approximately $355 per square foot. 218 Jesse Way is a home located in San Bernardino County with nearby schools including Crafton Elementary School, Moore Middle School, and Redlands East Valley High School.
Ownership History
Date
Name
Owned For
Owner Type
Purchase Details
Closed on
Mar 18, 2020
Sold by
Collier Sandra Lee
Bought by
Collier Sandra Lee and 2020 Sandra Lee Collier Trust
Current Estimated Value
Purchase Details
Closed on
Jul 5, 2005
Sold by
Mcnamara Rina R
Bought by
Mcnamara Joseph P
Purchase Details
Closed on
Oct 1, 2003
Sold by
Lee Henry K
Bought by
Lee Henry K and 1994 Lee Family Trust
Purchase Details
Closed on
Jul 22, 1994
Sold by
Lee Henry K and Lee Nancy
Bought by
Lee Henry K and Lee Nancy
Create a Home Valuation Report for This Property
The Home Valuation Report is an in-depth analysis detailing your home's value as well as a comparison with similar homes in the area
Home Values in the Area
Average Home Value in this Area
Purchase History
| Date | Buyer | Sale Price | Title Company |
|---|---|---|---|
| Collier Sandra Lee | -- | None Available | |
| Collier Sandra Lee | -- | None Available | |
| Mcnamara Joseph P | -- | -- | |
| Lee Henry K | -- | -- | |
| Lee Henry K | -- | -- |
Source: Public Records
Tax History
| Year | Tax Paid | Tax Assessment Tax Assessment Total Assessment is a certain percentage of the fair market value that is determined by local assessors to be the total taxable value of land and additions on the property. | Land | Improvement |
|---|---|---|---|---|
| 2025 | $3,982 | $318,976 | $53,595 | $265,381 |
| 2024 | $3,719 | $312,721 | $52,544 | $260,177 |
| 2023 | $3,715 | $306,589 | $51,514 | $255,075 |
| 2022 | $3,661 | $300,578 | $50,504 | $250,074 |
| 2021 | $3,728 | $294,685 | $49,514 | $245,171 |
| 2020 | $3,673 | $291,663 | $49,006 | $242,657 |
| 2019 | $3,570 | $285,944 | $48,045 | $237,899 |
| 2018 | $3,481 | $280,337 | $47,103 | $233,234 |
| 2017 | $3,452 | $274,840 | $46,179 | $228,661 |
| 2016 | $3,413 | $269,451 | $45,274 | $224,177 |
| 2015 | $3,388 | $265,404 | $44,594 | $220,810 |
| 2014 | $3,327 | $260,205 | $43,720 | $216,485 |
Source: Public Records
Map
Nearby Homes
- 1556 Gary Ln
- 212 Eastpark Ln
- 56 Dearborn Cir
- 1592 Christopher Ln
- 1665 Wabash Ave
- 1476 Moore St
- 100 Amber Ct
- 1479 Moore St
- 1458 Moore St
- 1575 Christopher Ln
- 1452 Moore St
- Belmont Plan at Havenwood
- Camden Plan at Havenwood
- Lexington Plan at Havenwood
- Windsor Plan at Havenwood
- 1580 Lisa Ln
- 1442 Moore St
- 1410 Pleasantview Dr
- 1550 Marion Rd
- 1528 Laramie Ave
Your Personal Tour Guide
Ask me questions while you tour the home.