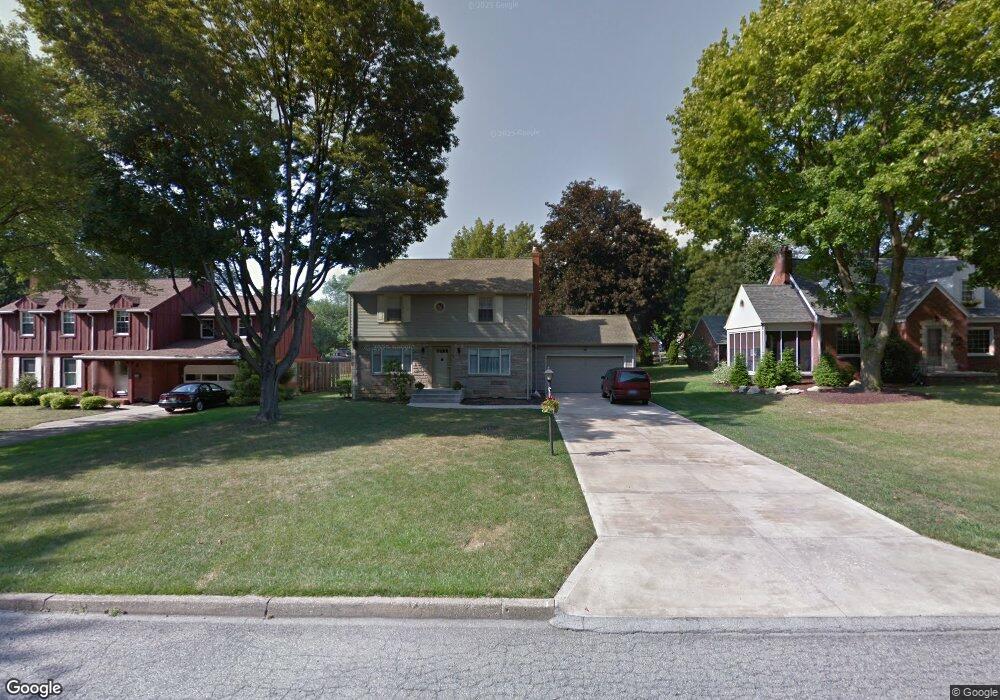
218 Wolcott Dr Youngstown, OH 44512
Estimated Value: $223,416 - $274,000
3
Beds
2
Baths
1,784
Sq Ft
$135/Sq Ft
Est. Value
About This Home
This home is located at 218 Wolcott Dr, Youngstown, OH 44512 and is currently estimated at $241,354, approximately $135 per square foot. 218 Wolcott Dr is a home located in Mahoning County with nearby schools including Boardman Center Middle School, Boardman High School, and Youngstown Christian School.
Ownership History
Date
Name
Owned For
Owner Type
Purchase Details
Closed on
Sep 29, 2020
Sold by
Slavens Brian J and Slavens Mary A
Bought by
Hughes Katherine N
Current Estimated Value
Home Financials for this Owner
Home Financials are based on the most recent Mortgage that was taken out on this home.
Original Mortgage
$161,500
Outstanding Balance
$142,012
Interest Rate
2.9%
Mortgage Type
New Conventional
Estimated Equity
$99,342
Purchase Details
Closed on
May 31, 2017
Sold by
Bellino Julianna and Estate Of Elizabeth Gavura
Bought by
Slavens Brian J and Vinopal Mary A
Home Financials for this Owner
Home Financials are based on the most recent Mortgage that was taken out on this home.
Original Mortgage
$128,368
Interest Rate
3.97%
Mortgage Type
FHA
Purchase Details
Closed on
Mar 19, 2004
Sold by
Cutrer Jody Ann
Bought by
Gavura Elizabeth A
Purchase Details
Closed on
Jan 10, 1994
Bought by
Cutrer Jody A
Create a Home Valuation Report for This Property
The Home Valuation Report is an in-depth analysis detailing your home's value as well as a comparison with similar homes in the area
Home Values in the Area
Average Home Value in this Area
Purchase History
| Date | Buyer | Sale Price | Title Company |
|---|---|---|---|
| Hughes Katherine N | $170,000 | None Available | |
| Slavens Brian J | $380,000 | None Available | |
| Gavura Elizabeth A | -- | -- | |
| Cutrer Jody A | $95,000 | -- |
Source: Public Records
Mortgage History
| Date | Status | Borrower | Loan Amount |
|---|---|---|---|
| Open | Hughes Katherine N | $161,500 | |
| Previous Owner | Slavens Brian J | $128,368 |
Source: Public Records
Tax History
| Year | Tax Paid | Tax Assessment Tax Assessment Total Assessment is a certain percentage of the fair market value that is determined by local assessors to be the total taxable value of land and additions on the property. | Land | Improvement |
|---|---|---|---|---|
| 2025 | $3,072 | $62,110 | $8,210 | $53,900 |
| 2024 | $3,144 | $62,110 | $8,210 | $53,900 |
| 2023 | $3,083 | $62,110 | $8,210 | $53,900 |
| 2022 | $3,037 | $46,820 | $7,620 | $39,200 |
| 2021 | $3,039 | $46,820 | $7,620 | $39,200 |
| 2020 | $3,055 | $46,820 | $7,620 | $39,200 |
| 2019 | $2,952 | $40,710 | $6,630 | $34,080 |
| 2018 | $2,027 | $40,710 | $6,630 | $34,080 |
| 2017 | $2,024 | $40,710 | $6,630 | $34,080 |
| 2016 | $2,007 | $40,140 | $7,210 | $32,930 |
| 2015 | $1,967 | $40,140 | $7,210 | $32,930 |
| 2014 | -- | $40,140 | $7,210 | $32,930 |
| 2013 | $1,948 | $40,140 | $7,210 | $32,930 |
Source: Public Records
Map
Nearby Homes
- 311 Brainard Dr
- 227 Shields Rd
- 237 Shields Rd
- 244 Shields Rd
- 27 Erskine Ave
- 6180 Northlawn Ave
- 322 Shields Rd
- 5810 West Blvd
- 354 Ewing Rd
- 5200 West Blvd Unit 405
- 5200 West Blvd Unit 505
- 6511 Pembrooke Place
- 5503 Southern Blvd
- 477 Wildwood Dr
- 4833 Oak Knoll Dr
- 123 Melrose Ave
- 4941 Market St
- 96 Aylesboro Ave
- 28 Terrace Dr
- 165 Mathews Rd Unit A
- 228 Wolcott Dr
- 236 Wolcott Dr
- 204 Wolcott Dr
- 213 Brainard Dr
- 219 Brainard Dr
- 207 Brainard Dr
- 235 Brainard Dr
- 244 Wolcott Dr
- 203 Brainard Dr
- 180 Wolcott Dr
- 219 Wolcott Dr
- 211 Wolcott Dr
- 243 Brainard Dr
- 203 Wolcott Dr
- 175 Brainard Dr
- 176 Wolcott Dr
- 243 Wolcott Dr
- 181 Wolcott Dr
- 157 Brainard Dr
- 302 Griswold Dr
Your Personal Tour Guide
Ask me questions while you tour the home.