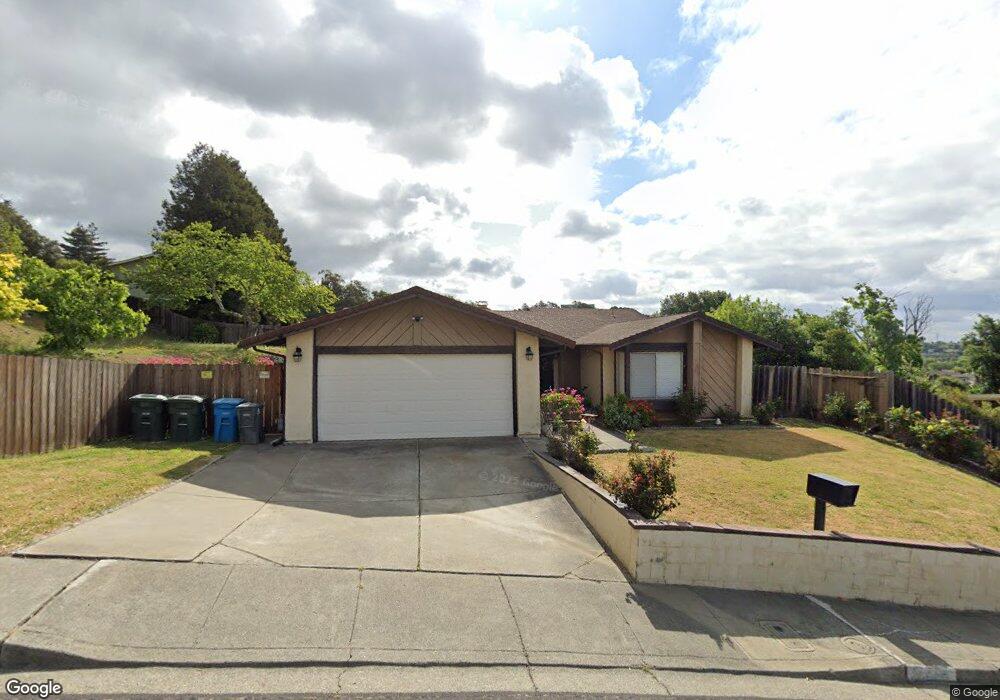
218 Woodson Way Vallejo, CA 94591
Woodridge NeighborhoodEstimated Value: $541,000 - $593,000
3
Beds
2
Baths
1,519
Sq Ft
$374/Sq Ft
Est. Value
About This Home
This home is located at 218 Woodson Way, Vallejo, CA 94591 and is currently estimated at $568,068, approximately $373 per square foot. 218 Woodson Way is a home located in Solano County with nearby schools including Joseph H. Wardlaw Elementary School, Hogan Middle School, and Jesse M. Bethel High School.
Ownership History
Date
Name
Owned For
Owner Type
Purchase Details
Closed on
Dec 26, 2013
Sold by
Youssef Sameh and Youssef Yesenia
Bought by
Roy Richard P and Roy Michelle C
Current Estimated Value
Home Financials for this Owner
Home Financials are based on the most recent Mortgage that was taken out on this home.
Original Mortgage
$237,500
Outstanding Balance
$178,401
Interest Rate
4.26%
Mortgage Type
New Conventional
Estimated Equity
$389,667
Purchase Details
Closed on
Jun 16, 2009
Sold by
Gmac Mortgage Llc
Bought by
Youssef Sameh and Youssef Yesenia
Purchase Details
Closed on
Dec 18, 2008
Sold by
Bravo Jose
Bought by
Gmac Mortgage Llc and Gmac Mortgage Corporation
Purchase Details
Closed on
Oct 20, 2003
Sold by
Mckevitt Edward C and Mckevitt Angelina
Bought by
Bravo Jose
Home Financials for this Owner
Home Financials are based on the most recent Mortgage that was taken out on this home.
Original Mortgage
$256,000
Interest Rate
4.87%
Mortgage Type
Purchase Money Mortgage
Create a Home Valuation Report for This Property
The Home Valuation Report is an in-depth analysis detailing your home's value as well as a comparison with similar homes in the area
Home Values in the Area
Average Home Value in this Area
Purchase History
| Date | Buyer | Sale Price | Title Company |
|---|---|---|---|
| Roy Richard P | $270,000 | First American Title Company | |
| Youssef Sameh | $215,000 | First American Title Company | |
| Gmac Mortgage Llc | $225,000 | First American Title Company | |
| Bravo Jose | $356,000 | North American Title Co |
Source: Public Records
Mortgage History
| Date | Status | Borrower | Loan Amount |
|---|---|---|---|
| Open | Roy Richard P | $237,500 | |
| Previous Owner | Bravo Jose | $256,000 |
Source: Public Records
Tax History Compared to Growth
Tax History
| Year | Tax Paid | Tax Assessment Tax Assessment Total Assessment is a certain percentage of the fair market value that is determined by local assessors to be the total taxable value of land and additions on the property. | Land | Improvement |
|---|---|---|---|---|
| 2025 | $5,047 | $330,972 | $79,676 | $251,296 |
| 2024 | $5,047 | $324,483 | $78,114 | $246,369 |
| 2023 | $4,771 | $318,122 | $76,583 | $241,539 |
| 2022 | $4,676 | $311,885 | $75,082 | $236,803 |
| 2021 | $4,574 | $305,770 | $73,610 | $232,160 |
| 2020 | $4,594 | $302,636 | $72,856 | $229,780 |
| 2019 | $4,461 | $296,703 | $71,428 | $225,275 |
| 2018 | $4,189 | $290,886 | $70,028 | $220,858 |
| 2017 | $4,011 | $285,183 | $68,655 | $216,528 |
| 2016 | $3,426 | $279,592 | $67,309 | $212,283 |
| 2015 | $3,381 | $275,393 | $66,298 | $209,095 |
| 2014 | $2,796 | $225,856 | $31,514 | $194,342 |
Source: Public Records
Map
Nearby Homes
- 212 Woodson Way
- 249 Woodridge Dr
- 255 Woodridge Dr
- 241 Woodridge Dr
- 230 Woodson Way
- 206 Woodson Way
- 219 Woodson Way
- 261 Woodridge Dr
- 233 Woodridge Dr
- 213 Woodson Way
- 225 Woodson Way
- 200 Woodson Way
- 225 Woodridge Dr
- 267 Woodridge Dr
- 248 Woodridge Dr
- 236 Woodson Way
- 254 Woodridge Dr
- 242 Woodridge Dr
- 231 Woodson Way
- 207 Woodson Way