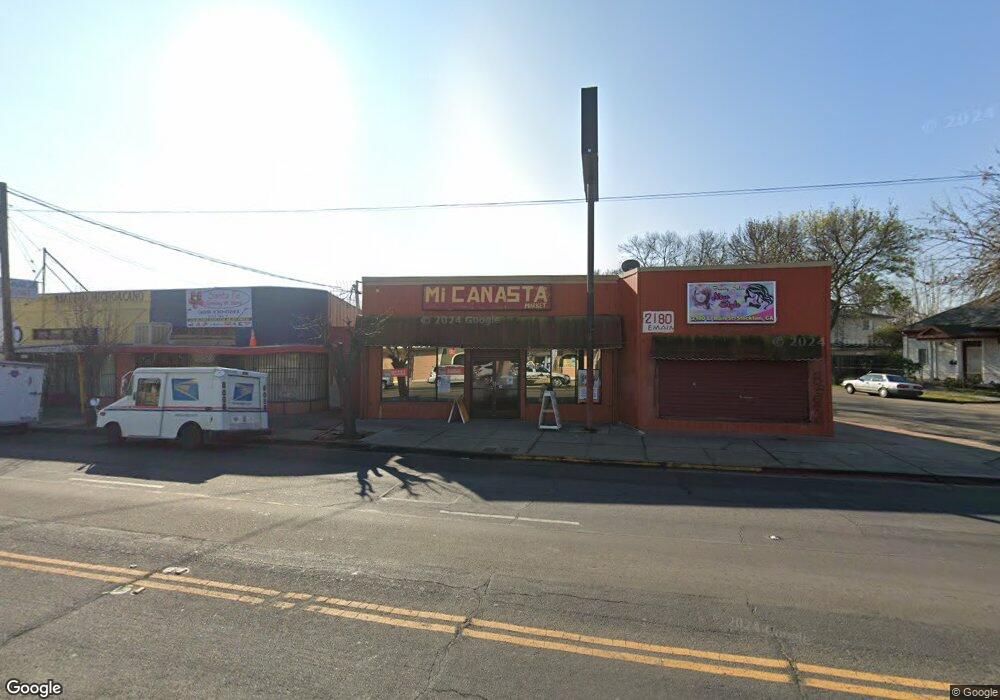
2180 E Main St Stockton, CA 95205
East Stockton NeighborhoodEstimated Value: $310,828
Studio
--
Bath
3,089
Sq Ft
$101/Sq Ft
Est. Value
About This Home
This home is located at 2180 E Main St, Stockton, CA 95205 and is currently estimated at $310,828, approximately $100 per square foot. 2180 E Main St is a home located in San Joaquin County with nearby schools including King Elementary School, Roosevelt Elementary School, and John C. Fremont Elementary School.
Ownership History
Date
Name
Owned For
Owner Type
Purchase Details
Closed on
Jun 19, 2011
Sold by
Aguilera Alfonso C
Bought by
Aguilera Alfonso C and Celis Maria Elena
Current Estimated Value
Purchase Details
Closed on
Mar 23, 2011
Sold by
I B Property Holdings Llc
Bought by
Aguilera Alfonso C
Purchase Details
Closed on
Jun 24, 2008
Sold by
Macedo Pedro and Macedo Patricia
Bought by
Ib Property Holdings Llc
Purchase Details
Closed on
Mar 16, 2006
Sold by
Macedo Pedro
Bought by
Macedo Pedro and Macedo Patricia
Home Financials for this Owner
Home Financials are based on the most recent Mortgage that was taken out on this home.
Original Mortgage
$436,796
Interest Rate
6.18%
Mortgage Type
Commercial
Purchase Details
Closed on
Oct 15, 1998
Sold by
Diaz Pete R
Bought by
Macedo Pedro
Home Financials for this Owner
Home Financials are based on the most recent Mortgage that was taken out on this home.
Original Mortgage
$127,500
Interest Rate
6.71%
Mortgage Type
Commercial
Create a Home Valuation Report for This Property
The Home Valuation Report is an in-depth analysis detailing your home's value as well as a comparison with similar homes in the area
Home Values in the Area
Average Home Value in this Area
Purchase History
| Date | Buyer | Sale Price | Title Company |
|---|---|---|---|
| Aguilera Alfonso C | -- | None Available | |
| Aguilera Alfonso C | $95,000 | North American Title Co Inc | |
| Ib Property Holdings Llc | $441,838 | Accommodation | |
| Macedo Pedro | -- | First American Title Co | |
| Macedo Pedro | $150,000 | Alliance Title Company |
Source: Public Records
Mortgage History
| Date | Status | Borrower | Loan Amount |
|---|---|---|---|
| Previous Owner | Macedo Pedro | $436,796 | |
| Previous Owner | Macedo Pedro | $127,500 |
Source: Public Records
Tax History
| Year | Tax Paid | Tax Assessment Tax Assessment Total Assessment is a certain percentage of the fair market value that is determined by local assessors to be the total taxable value of land and additions on the property. | Land | Improvement |
|---|---|---|---|---|
| 2025 | $1,529 | $121,702 | $44,836 | $76,866 |
| 2024 | $1,504 | $119,316 | $43,957 | $75,359 |
| 2023 | $1,470 | $116,978 | $43,096 | $73,882 |
| 2022 | $1,448 | $114,685 | $42,251 | $72,434 |
| 2021 | $1,392 | $112,437 | $41,423 | $71,014 |
| 2020 | $1,418 | $111,285 | $40,999 | $70,286 |
| 2019 | $1,412 | $109,104 | $40,196 | $68,908 |
| 2018 | $1,386 | $106,965 | $39,408 | $67,557 |
| 2017 | $1,313 | $104,869 | $38,636 | $66,233 |
| 2016 | $1,337 | $102,814 | $37,879 | $64,935 |
| 2014 | $1,273 | $99,286 | $36,579 | $62,707 |
Source: Public Records
Map
Nearby Homes
- 2229 Alma St
- 2247 Alma St
- 2006 E Lafayette St
- 2217 E Hazelton Ave
- 2125 E Myrtle St
- 2362 Alma St
- 2387 E Lafayette St
- 2415 E Taylor St
- 2423 E Taylor St
- 2477 E Washington St
- 2497 E Marsh St
- 2368 E Weber Ave
- 0 Park Unit SR25247647
- 2330 Finland Ave
- 2360 Finland Ave
- 511 Burkett Ave
- 404 S Shasta Ave
- 29 S Sierra Nevada St
- 1636 E Anderson St
- 336 S Airport Way
- 337 S Ash St
- 323 S Ash St
- 2153 E Sonora St
- 2176 E Sonora St
- 2149 E Sonora St
- 2151 E Main St
- 351 S Ash St
- 2150 E Main St
- 2161 E Main St
- 2196 E Sonora St
- 2125 E Main St
- 2139 E Sonora St
- 2169 E Main St
- 359 S Ash St
- 2177 E Main St
- 2137 E Sonora St
- 367 S Ash St
- 2208 E Main St
- 2138 E Sonora St
- 2189 E Main St
Your Personal Tour Guide
Ask me questions while you tour the home.