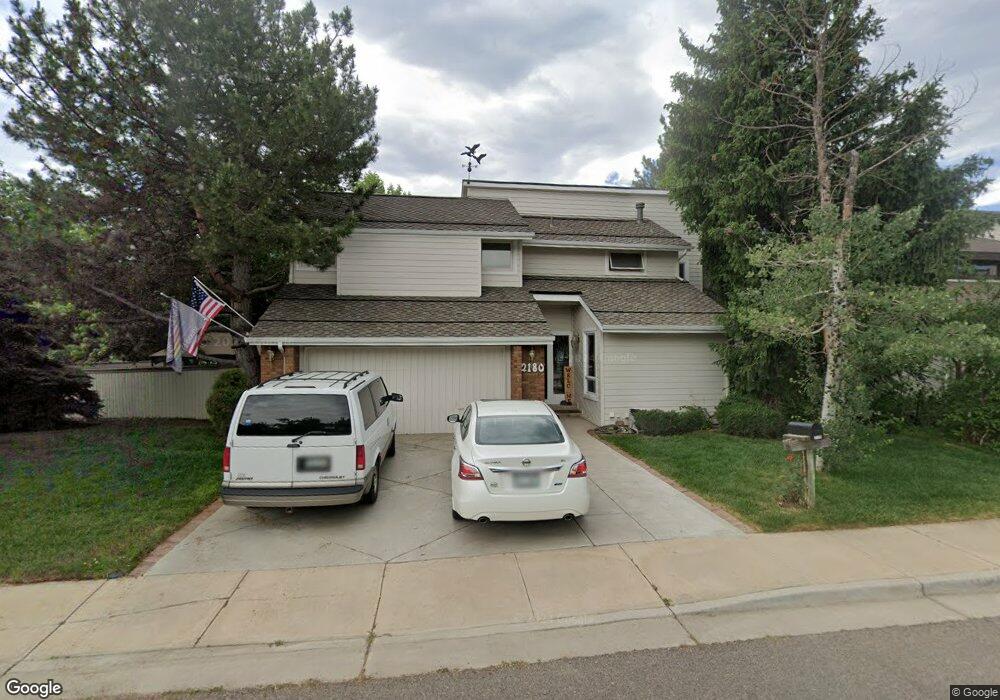
2180 Jonathan Place Boulder, CO 80304
North Boulder NeighborhoodEstimated Value: $1,205,000 - $1,664,000
4
Beds
3
Baths
2,513
Sq Ft
$579/Sq Ft
Est. Value
About This Home
This home is located at 2180 Jonathan Place, Boulder, CO 80304 and is currently estimated at $1,456,047, approximately $579 per square foot. 2180 Jonathan Place is a home located in Boulder County with nearby schools including Columbine Elementary School, Centennial Middle School, and Boulder High School.
Ownership History
Date
Name
Owned For
Owner Type
Purchase Details
Closed on
Feb 22, 2010
Sold by
Donovan Janice K
Bought by
Donovan Michael G
Current Estimated Value
Purchase Details
Closed on
May 25, 2002
Sold by
Donovan Michael G
Bought by
Donovan Michael G and Donovan Ruth B
Home Financials for this Owner
Home Financials are based on the most recent Mortgage that was taken out on this home.
Original Mortgage
$300,000
Outstanding Balance
$125,698
Interest Rate
6.82%
Estimated Equity
$1,330,349
Purchase Details
Closed on
Sep 27, 1989
Bought by
Donovan Michael G
Purchase Details
Closed on
Jun 5, 1984
Bought by
Donovan Michael G
Purchase Details
Closed on
May 13, 1981
Bought by
Donovan Michael G
Purchase Details
Closed on
Sep 21, 1978
Bought by
Donovan Michael G
Create a Home Valuation Report for This Property
The Home Valuation Report is an in-depth analysis detailing your home's value as well as a comparison with similar homes in the area
Home Values in the Area
Average Home Value in this Area
Purchase History
| Date | Buyer | Sale Price | Title Company |
|---|---|---|---|
| Donovan Michael G | -- | None Available | |
| Donovan Michael G | -- | None Available | |
| Donovan Michael G | -- | -- | |
| Donovan Michael G | -- | -- | |
| Donovan Michael G | $164,300 | -- | |
| Donovan Michael G | $222,000 | -- | |
| Donovan Michael G | $162,500 | -- | |
| Donovan Michael G | -- | -- |
Source: Public Records
Mortgage History
| Date | Status | Borrower | Loan Amount |
|---|---|---|---|
| Open | Donovan Michael G | $300,000 |
Source: Public Records
Tax History
| Year | Tax Paid | Tax Assessment Tax Assessment Total Assessment is a certain percentage of the fair market value that is determined by local assessors to be the total taxable value of land and additions on the property. | Land | Improvement |
|---|---|---|---|---|
| 2025 | $7,002 | $80,376 | $34,713 | $45,663 |
| 2024 | $7,002 | $80,376 | $34,713 | $45,663 |
| 2023 | $6,881 | $86,376 | $36,260 | $53,801 |
| 2022 | $5,823 | $69,653 | $28,995 | $40,658 |
| 2021 | $5,553 | $71,658 | $29,830 | $41,828 |
| 2020 | $5,490 | $70,221 | $28,100 | $42,121 |
| 2019 | $5,406 | $70,221 | $28,100 | $42,121 |
| 2018 | $5,057 | $65,527 | $26,208 | $39,319 |
| 2017 | $5,503 | $72,444 | $28,974 | $43,470 |
| 2016 | $5,669 | $65,487 | $26,188 | $39,299 |
| 2015 | $5,368 | $43,732 | $13,850 | $29,882 |
| 2014 | $3,677 | $43,732 | $13,850 | $29,882 |
Source: Public Records
Map
Nearby Homes
- 2025 Hermosa Dr
- 2006 Joslyn Place
- 1850 Iris Ave
- 3540 19th St
- 3320 23rd St
- 3505 19th St
- 1845 Iris Ave
- 3621 21st St
- 2055 Kalmia Ave
- 2435 Hawthorn Ave
- 2540 Iris Ave
- 1950 Glenwood Dr
- 1930 Grape Ave
- 1737 Hawthorn Place
- 3150 19th St
- 1717 Iris Ave
- 3633 21st St
- 2636 Juniper Ave Unit 1
- 1805 Forest Ave
- 2645 Tabriz Place Unit 22
- 2160 Jonathan Place
- 3435 22nd St Unit 37
- 3425 22nd St Unit 36
- 3415 22nd St Unit 35
- 3405 22nd St Unit 34
- 2181 Jonathan Place
- 2171 Jonathan Place
- 3410 22nd St
- 3420 22nd St Unit 3
- 3440 22nd St
- 2140 Jonathan Place
- 3430 22nd St Unit 4
- 3400 22nd St Unit 1
- 2161 Jonathan Place
- 3450 22nd St
- 2130 Jonathan Place
- 3456 22nd St
- 2141 Jonathan Place
- 3460 22nd St
- 2182 Jordan Place
Your Personal Tour Guide
Ask me questions while you tour the home.