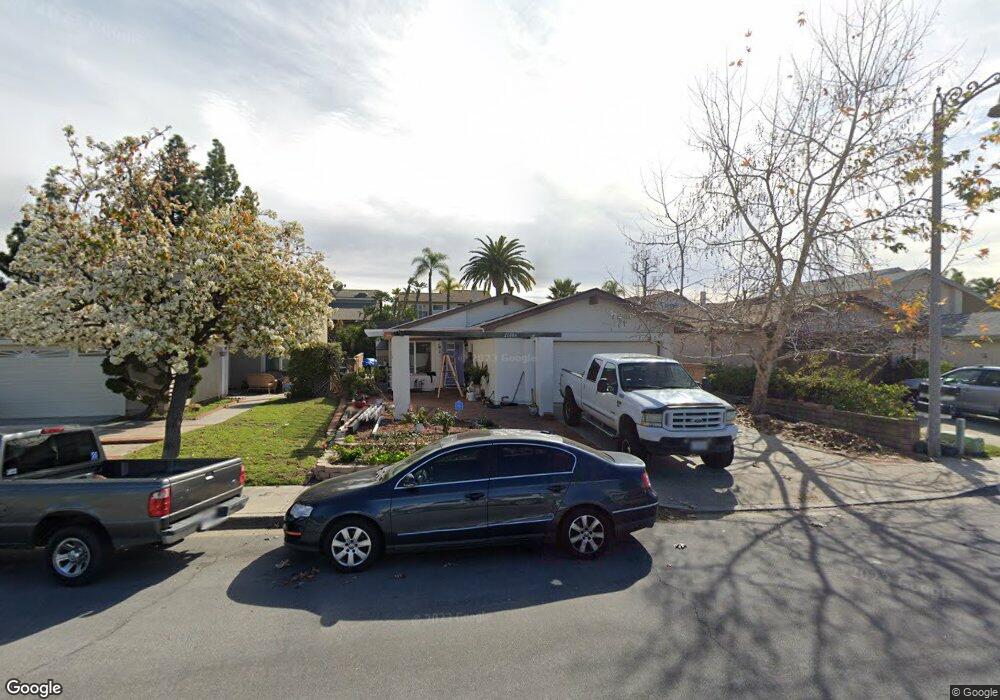
21806 Calabaza Mission Viejo, CA 92691
Estimated Value: $1,022,626 - $1,060,000
3
Beds
2
Baths
1,120
Sq Ft
$934/Sq Ft
Est. Value
About This Home
This home is located at 21806 Calabaza, Mission Viejo, CA 92691 and is currently estimated at $1,045,907, approximately $933 per square foot. 21806 Calabaza is a home located in Orange County with nearby schools including Del Lago Elementary School, Los Alisos Intermediate School, and Trabuco Hills High School.
Ownership History
Date
Name
Owned For
Owner Type
Purchase Details
Closed on
Oct 13, 2021
Sold by
Diane Wayland Wendy
Bought by
Wendy Diane Wayland Revocable Living Trust
Current Estimated Value
Purchase Details
Closed on
May 13, 2009
Sold by
Robinson Tracy J
Bought by
Wayland Wendy Diane
Home Financials for this Owner
Home Financials are based on the most recent Mortgage that was taken out on this home.
Original Mortgage
$394,423
Interest Rate
4.83%
Mortgage Type
FHA
Purchase Details
Closed on
Jan 23, 2006
Sold by
Ton That Giao Mong and Ton That Dung Nguyen
Bought by
Robinson Tracy J
Home Financials for this Owner
Home Financials are based on the most recent Mortgage that was taken out on this home.
Original Mortgage
$487,200
Interest Rate
1%
Mortgage Type
Purchase Money Mortgage
Create a Home Valuation Report for This Property
The Home Valuation Report is an in-depth analysis detailing your home's value as well as a comparison with similar homes in the area
Home Values in the Area
Average Home Value in this Area
Purchase History
| Date | Buyer | Sale Price | Title Company |
|---|---|---|---|
| Wendy Diane Wayland Revocable Living Trust | -- | None Listed On Document | |
| Wayland Wendy Diane | $402,000 | Orange Coast Title | |
| Robinson Tracy J | $609,000 | Ticor Title |
Source: Public Records
Mortgage History
| Date | Status | Borrower | Loan Amount |
|---|---|---|---|
| Previous Owner | Wayland Wendy Diane | $394,423 | |
| Previous Owner | Robinson Tracy J | $487,200 |
Source: Public Records
Tax History Compared to Growth
Tax History
| Year | Tax Paid | Tax Assessment Tax Assessment Total Assessment is a certain percentage of the fair market value that is determined by local assessors to be the total taxable value of land and additions on the property. | Land | Improvement |
|---|---|---|---|---|
| 2025 | $5,163 | $517,287 | $424,812 | $92,475 |
| 2024 | $5,163 | $507,145 | $416,483 | $90,662 |
| 2023 | $5,040 | $497,201 | $408,316 | $88,885 |
| 2022 | $4,949 | $487,452 | $400,309 | $87,143 |
| 2021 | $4,849 | $477,895 | $392,460 | $85,435 |
| 2020 | $4,805 | $472,995 | $388,436 | $84,559 |
| 2019 | $4,708 | $463,721 | $380,820 | $82,901 |
| 2018 | $4,619 | $454,629 | $373,353 | $81,276 |
| 2017 | $4,525 | $445,715 | $366,032 | $79,683 |
| 2016 | $4,449 | $436,976 | $358,855 | $78,121 |
| 2015 | $4,411 | $430,413 | $353,465 | $76,948 |
| 2014 | $4,315 | $421,982 | $346,541 | $75,441 |
Source: Public Records
Map
Nearby Homes
- 21691 Cabrosa
- 27436 Sereno
- 22068 Antigua
- 27691 Alarcon
- 27982 Virginia
- 21671 Fernbrook Unit 186
- 21795 Tobarra
- 28052 Virginia
- 21262 Bristlecone
- 22402 Valdemosa Unit 19
- 28242 Elmwood
- 21952 Esplendor
- 22422 Porreras Unit 7
- 22396 Estallens Unit 56
- 21175 Tangerine Unit 119
- 21981 Birchwood
- 27662 Esla
- 21722 Fairbrook Unit 45
- 27906 Amber Unit 231
- 27191 Valleymont Rd