Estimated Value: $235,000 - $251,000
3
Beds
2
Baths
1,220
Sq Ft
$200/Sq Ft
Est. Value
About This Home
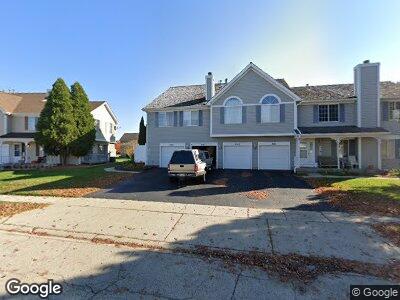
This home is located at 2181 Colorado Ave Unit 3, Elgin, IL 60123 and is currently estimated at $243,532, approximately $199 per square foot. 2181 Colorado Ave Unit 3 is a home located in Kane County with nearby schools including Creekside Elementary School, Kimball Middle School, and Larkin High School.
Ownership History
Date
Name
Owned For
Owner Type
Purchase Details
Closed on
Jul 7, 1997
Sold by
Williams Keith B and Williams Karen E
Bought by
Halbmaier Jeffrey S
Current Estimated Value
Purchase Details
Closed on
Nov 5, 1995
Sold by
Halbmaier Jeffrey S
Bought by
Williams Keith B and Williams Karen E
Home Financials for this Owner
Home Financials are based on the most recent Mortgage that was taken out on this home.
Original Mortgage
$91,300
Interest Rate
6.75%
Mortgage Type
FHA
Purchase Details
Closed on
Oct 25, 1995
Sold by
Williams Arthur E
Bought by
Williams Keith B and Williams Karen E
Home Financials for this Owner
Home Financials are based on the most recent Mortgage that was taken out on this home.
Original Mortgage
$91,300
Interest Rate
6.75%
Mortgage Type
FHA
Create a Home Valuation Report for This Property
The Home Valuation Report is an in-depth analysis detailing your home's value as well as a comparison with similar homes in the area
Home Values in the Area
Average Home Value in this Area
Purchase History
| Date | Buyer | Sale Price | Title Company |
|---|---|---|---|
| Halbmaier Jeffrey S | -- | Chicago Title Insurance Co | |
| Williams Keith B | -- | -- | |
| Williams Keith B | $94,000 | -- |
Source: Public Records
Mortgage History
| Date | Status | Borrower | Loan Amount |
|---|---|---|---|
| Open | Halbmaier Jeffrey S | $183,500 | |
| Closed | Halbmaier Jeffrey S | $175,000 | |
| Closed | Halbmaier Jeffrey S | $165,000 | |
| Closed | Halbmaier Jeffrey S | $157,320 | |
| Closed | Halbmaier Jeff | $127,500 | |
| Previous Owner | Williams Keith B | $91,300 |
Source: Public Records
Tax History Compared to Growth
Tax History
| Year | Tax Paid | Tax Assessment Tax Assessment Total Assessment is a certain percentage of the fair market value that is determined by local assessors to be the total taxable value of land and additions on the property. | Land | Improvement |
|---|---|---|---|---|
| 2023 | $4,264 | $58,021 | $15,516 | $42,505 |
| 2022 | $4,067 | $52,905 | $14,148 | $38,757 |
| 2021 | $3,878 | $49,462 | $13,227 | $36,235 |
| 2020 | $3,759 | $47,219 | $12,627 | $34,592 |
| 2019 | $3,641 | $44,979 | $12,028 | $32,951 |
| 2018 | $3,596 | $42,373 | $11,331 | $31,042 |
| 2017 | $3,503 | $40,058 | $10,712 | $29,346 |
| 2016 | $3,324 | $37,163 | $9,938 | $27,225 |
| 2015 | $3,882 | $34,063 | $9,109 | $24,954 |
| 2014 | $3,882 | $31,402 | $8,997 | $22,405 |
| 2013 | $3,882 | $32,230 | $9,234 | $22,996 |
Source: Public Records
Map
Nearby Homes
- 2205 Colorado Ave Unit 4
- 2270 Valley Creek Dr
- 2236 Valley Creek Dr
- 2170 Niagara Ct
- 631 Alice Ct
- 2323 Bluejay Trail Unit 2323
- 2055 Royal Blvd Unit 9
- 640 Highland Springs Dr
- Lot 1 Highland Springs Dr
- 576 Madison Ln
- 572 Madison Ln
- 816 Millcreek Cir
- 622 Robin Ridge
- 805 Millcreek Cir
- 924 Millcreek Cir
- 540 Shenandoah Trail
- 535 Shagbark Dr
- 2184 Jordan Ct
- 919 Millcreek Cir
- 494 Shenandoah Trail
- 2181 Colorado Ave Unit 3
- 2191 Colorado Ave Unit B
- 2171 Colorado Ave
- 2193 Colorado Ave Unit 1
- 2176 Colorado Ave Unit 2
- 2146 Colorado Ave Unit 1
- 2172 Colorado Ave Unit 4
- 2126 Colorado Ave Unit 3
- 2162 Colorado Ave Unit 4
- 2190 Colorado Ave Unit 2
- 2142 Colorado Ave Unit 4
- 2166 Colorado Ave Unit 2
- 2124 Colorado Ave
- 2172 Colorado Ave Unit 2172
- 2170 Colorado Ave Unit 3
- 2194 Colorado Ave Unit 4
- 2192 Colorado Ave Unit 1
- 2196 Colorado Ave Unit 3
- 2175 Colorado Ave Unit 1