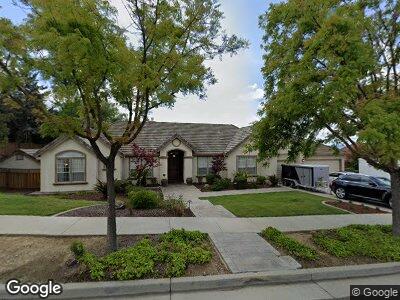
2181 Shadow Ridge Way San Jose, CA 95138
Silver Creek NeighborhoodEstimated Value: $3,094,308 - $3,414,000
4
Beds
3
Baths
2,778
Sq Ft
$1,182/Sq Ft
Est. Value
About This Home
This home is located at 2181 Shadow Ridge Way, San Jose, CA 95138 and is currently estimated at $3,283,327, approximately $1,181 per square foot. 2181 Shadow Ridge Way is a home located in Santa Clara County with nearby schools including James Franklin Smith Elementary School, Chaboya Middle School, and Silver Creek High School.
Ownership History
Date
Name
Owned For
Owner Type
Purchase Details
Closed on
Oct 30, 2020
Sold by
Yow Cott Vincent and Yow Scott V
Bought by
Yow Scott Vincent
Current Estimated Value
Home Financials for this Owner
Home Financials are based on the most recent Mortgage that was taken out on this home.
Original Mortgage
$150,000
Outstanding Balance
$130,031
Interest Rate
2.8%
Mortgage Type
Credit Line Revolving
Estimated Equity
$3,153,296
Purchase Details
Closed on
Dec 3, 2009
Sold by
Yow Scott V and Yow Abegail M
Bought by
Yow Scott
Home Financials for this Owner
Home Financials are based on the most recent Mortgage that was taken out on this home.
Original Mortgage
$192,750
Interest Rate
4.78%
Mortgage Type
Credit Line Revolving
Purchase Details
Closed on
Sep 24, 2007
Sold by
Gonzalez Jaime A and Talus Paula A
Bought by
Yow Scott
Home Financials for this Owner
Home Financials are based on the most recent Mortgage that was taken out on this home.
Original Mortgage
$1,060,000
Interest Rate
6.25%
Mortgage Type
Purchase Money Mortgage
Purchase Details
Closed on
Jun 23, 2004
Sold by
Kroesen Ronald J and Kroesen Patricia L
Bought by
Gonzalez Jaime A and Talus Paula A
Home Financials for this Owner
Home Financials are based on the most recent Mortgage that was taken out on this home.
Original Mortgage
$1,000,000
Interest Rate
5%
Mortgage Type
Purchase Money Mortgage
Purchase Details
Closed on
Nov 1, 1999
Sold by
William Crouch and William Lisa E
Bought by
Kroesen Ronald J and Kroesen Patricia L
Home Financials for this Owner
Home Financials are based on the most recent Mortgage that was taken out on this home.
Original Mortgage
$550,000
Interest Rate
7%
Purchase Details
Closed on
Oct 22, 1997
Sold by
Crouch William M
Bought by
Crouch William M and Crouch Lisa Esther
Purchase Details
Closed on
Apr 15, 1997
Sold by
Rutlen Deborah L
Bought by
Errey Robert B and Errey Tracey
Purchase Details
Closed on
Feb 6, 1996
Sold by
Greenbriar Partners
Bought by
Rutlen Deborah L
Create a Home Valuation Report for This Property
The Home Valuation Report is an in-depth analysis detailing your home's value as well as a comparison with similar homes in the area
Home Values in the Area
Average Home Value in this Area
Purchase History
| Date | Buyer | Sale Price | Title Company |
|---|---|---|---|
| Yow Scott Vincent | -- | Wfg National Title Ins Co | |
| Yow Scott | -- | Fidelity National Title Co | |
| Yow Scott | $1,560,000 | First American Title Company | |
| Gonzalez Jaime A | $1,350,000 | Old Republic Title Company | |
| Kroesen Ronald J | $855,000 | Stewart Title | |
| Crouch William M | -- | -- | |
| Crouch William | $675,000 | Old Republic Title Company | |
| Crouch William | -- | Old Republic Title Company | |
| Errey Robert B | $670,000 | First American Title Guarant | |
| Rutlen Deborah L | $563,000 | First American Title Guarant |
Source: Public Records
Mortgage History
| Date | Status | Borrower | Loan Amount |
|---|---|---|---|
| Open | Yow Scott Vincent | $150,000 | |
| Open | Yow Scott Vincent | $700,000 | |
| Closed | Yow Scott Vincent | $700,000 | |
| Closed | Yow Scott V | $200,000 | |
| Closed | Yow Scott V | $706,000 | |
| Closed | Yow Scott | $774,000 | |
| Closed | Yow Scott | $720,000 | |
| Closed | Yow Scott | $192,750 | |
| Closed | Yow Scott | $729,750 | |
| Closed | Yow Scott | $70,000 | |
| Closed | Yow Scott | $1,060,000 | |
| Previous Owner | Gonzalez Jaime A | $250,000 | |
| Previous Owner | Gonzalez Jaime A | $1,000,000 | |
| Previous Owner | Kroesen Ronald J | $532,000 | |
| Previous Owner | Kroesen Ronald J | $534,000 | |
| Previous Owner | Kroesen Ronald J | $535,800 | |
| Previous Owner | Kroesen Ronald J | $538,500 | |
| Previous Owner | Kroesen Ronald J | $540,000 | |
| Previous Owner | Kroesen Ronald J | $541,500 | |
| Previous Owner | Kroesen Ronald J | $550,000 |
Source: Public Records
Tax History Compared to Growth
Tax History
| Year | Tax Paid | Tax Assessment Tax Assessment Total Assessment is a certain percentage of the fair market value that is determined by local assessors to be the total taxable value of land and additions on the property. | Land | Improvement |
|---|---|---|---|---|
| 2024 | $27,231 | $2,008,898 | $1,004,449 | $1,004,449 |
| 2023 | $27,231 | $1,969,508 | $984,754 | $984,754 |
| 2022 | $26,675 | $1,930,892 | $965,446 | $965,446 |
| 2021 | $26,319 | $1,893,032 | $946,516 | $946,516 |
| 2020 | $25,216 | $1,873,622 | $936,811 | $936,811 |
| 2019 | $24,617 | $1,836,886 | $918,443 | $918,443 |
| 2018 | $24,460 | $1,800,870 | $900,435 | $900,435 |
| 2017 | $24,082 | $1,765,560 | $882,780 | $882,780 |
| 2016 | $22,963 | $1,730,942 | $865,471 | $865,471 |
| 2015 | $21,596 | $1,619,000 | $809,500 | $809,500 |
| 2014 | $18,058 | $1,394,000 | $697,000 | $697,000 |
Source: Public Records
Map
Nearby Homes
- 2102 Hillstone Dr
- 4715 Whitetail Ln
- 4627 Pacific Rim Way
- 2624 Yerba Vista Ct Unit 348
- 5107 Eastbourne Dr
- 5183 Apennines Cir
- 4115 Loganberry Dr
- 2846 Autumn Estates
- 5213 Silvercrest Ridge Ct
- 4701 Hill Top View Place
- 5233 Manderston Dr
- 4131 Middle Park Dr
- 1638 Heritage Bay Ct Unit 1
- 6141 Country Club Pkwy
- 1781 Indigo Oak Ln
- 5313 Creek Estates Ct
- 3239 Pinot Blanc Way
- 5384 Silver Trail Ct
- 5451 Ligurian Dr
- 3123 Lake Trasimeno Dr
- 2181 Shadow Ridge Way
- 2179 Shadow Ridge Way
- 2183 Shadow Ridge Way
- 2123 Ashley Ridge Ct
- 2117 Ashley Ridge Ct Unit 2117
- 2117 Ashley Ridge Ct
- 2186 Shadow Ridge Way
- 2182 Shadow Ridge Way
- 2177 Shadow Ridge Way
- 2189 Shadow Ridge Way
- 2122 Ashley Ridge Ct
- 2192 Briar Hills Ct
- 2188 Shadow Ridge Way
- 2111 Ashley Ridge Ct
- 2186 Briar Hills Ct
- 2178 Shadow Ridge Way
- 2118 Ashley Ridge Ct
- 2173 Shadow Ridge Way
- 2198 Briar Hills Ct