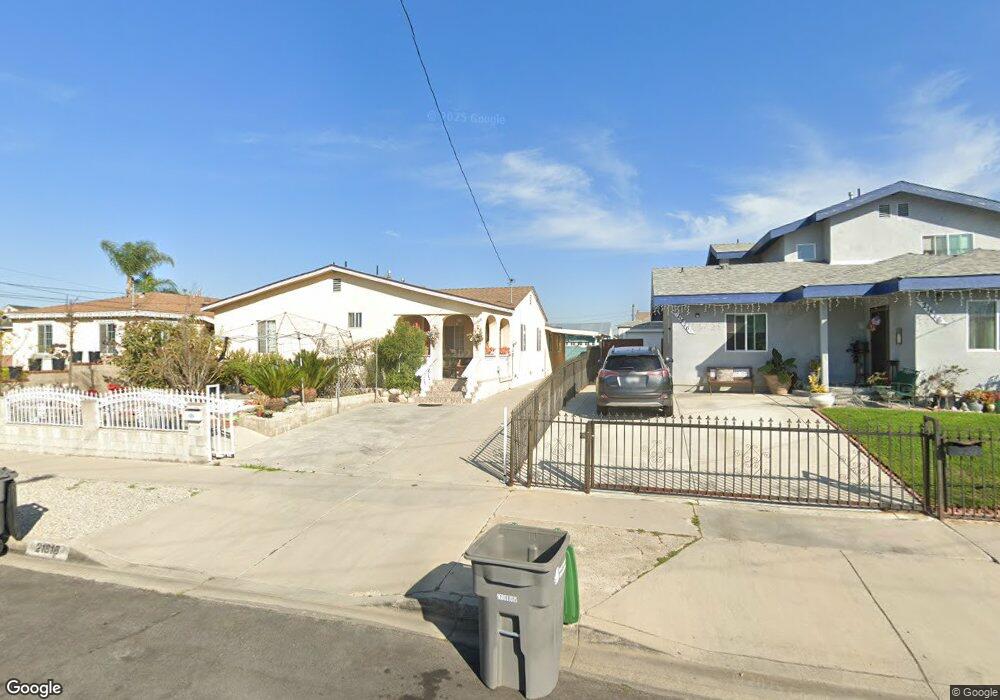
21818 Neptune Ave Carson, CA 90745
Estimated Value: $791,000 - $929,000
5
Beds
3
Baths
1,945
Sq Ft
$446/Sq Ft
Est. Value
About This Home
This home is located at 21818 Neptune Ave, Carson, CA 90745 and is currently estimated at $866,700, approximately $445 per square foot. 21818 Neptune Ave is a home located in Los Angeles County with nearby schools including Carson Street Elementary School, Andrew Carnegie Middle School, and Carson High School.
Ownership History
Date
Name
Owned For
Owner Type
Purchase Details
Closed on
Oct 1, 2020
Sold by
Fefuerzo Marlito Rafanan and Refuerzo Maria Ligaya
Bought by
Refuerzo Marlito Rafanan and Refuerzo Maria Ligaya
Current Estimated Value
Home Financials for this Owner
Home Financials are based on the most recent Mortgage that was taken out on this home.
Original Mortgage
$320,000
Outstanding Balance
$284,623
Interest Rate
2.9%
Mortgage Type
New Conventional
Estimated Equity
$582,077
Purchase Details
Closed on
May 6, 2002
Sold by
Haban Edelisa I and Refuerzo Maria Ligaya Haban
Bought by
Refuerzo Marlito R
Home Financials for this Owner
Home Financials are based on the most recent Mortgage that was taken out on this home.
Original Mortgage
$160,000
Interest Rate
6.74%
Purchase Details
Closed on
Aug 10, 2001
Sold by
Haban Edelisa I
Bought by
Haban Edelisa I
Create a Home Valuation Report for This Property
The Home Valuation Report is an in-depth analysis detailing your home's value as well as a comparison with similar homes in the area
Home Values in the Area
Average Home Value in this Area
Purchase History
| Date | Buyer | Sale Price | Title Company |
|---|---|---|---|
| Refuerzo Marlito Rafanan | -- | Wfg Title Company | |
| Refuerzo Marlito R | -- | American Coast Title | |
| Haban Edelisa I | -- | -- |
Source: Public Records
Mortgage History
| Date | Status | Borrower | Loan Amount |
|---|---|---|---|
| Open | Refuerzo Marlito Rafanan | $320,000 | |
| Previous Owner | Refuerzo Marlito R | $160,000 |
Source: Public Records
Tax History
| Year | Tax Paid | Tax Assessment Tax Assessment Total Assessment is a certain percentage of the fair market value that is determined by local assessors to be the total taxable value of land and additions on the property. | Land | Improvement |
|---|---|---|---|---|
| 2025 | $5,857 | $423,056 | $236,355 | $186,701 |
| 2024 | $5,857 | $414,762 | $231,721 | $183,041 |
| 2023 | $5,741 | $406,630 | $227,178 | $179,452 |
| 2022 | $5,463 | $398,658 | $222,724 | $175,934 |
| 2021 | $5,391 | $390,842 | $218,357 | $172,485 |
| 2019 | $5,196 | $379,252 | $211,882 | $167,370 |
| 2018 | $5,054 | $371,817 | $207,728 | $164,089 |
| 2016 | $4,832 | $357,380 | $199,662 | $157,718 |
| 2015 | $4,736 | $352,012 | $196,663 | $155,349 |
| 2014 | $4,727 | $345,117 | $192,811 | $152,306 |
Source: Public Records
Map
Nearby Homes
- 21826 Ravenna Ave
- 416 E 219th St
- 429 Willow Run Ln
- 21719 Neptune Ave
- 21730 Grace Ave Unit 2
- 536 E 220th St
- 692 Colorado Cir
- 325 E 222nd St
- 21610 Orrick Ave Unit 7
- 21403 Catskill Ave
- 535 E 223rd St Unit 12
- 21425 S Avalon Blvd Unit 22
- 21328 Orrick Ave
- 563 E 223rd St
- 121 E 223rd St Unit 5
- 121 E 223rd St Unit 3
- 127 W 219th Place
- 807 E Calbas St
- 814 E Calbas St
- 22031 Main St Unit 1
- 21814 Neptune Ave
- 21826 Neptune Ave
- 21808 Neptune Ave
- 21830 Neptune Ave
- 21819 Ravenna Ave
- 21813 Ravenna Ave
- 21825 Ravenna Ave
- 21804 Neptune Ave
- 415 E 219th St
- 409 E 219th St
- 21809 Ravenna Ave
- 21819 Neptune Ave
- 21815 Neptune Ave
- 21829 Ravenna Ave
- 21827 Neptune Ave
- 21800 Neptune Ave
- 357 E 219th St
- 21805 Ravenna Ave
- 21811 Neptune Ave
- 21807 Neptune Ave
Your Personal Tour Guide
Ask me questions while you tour the home.