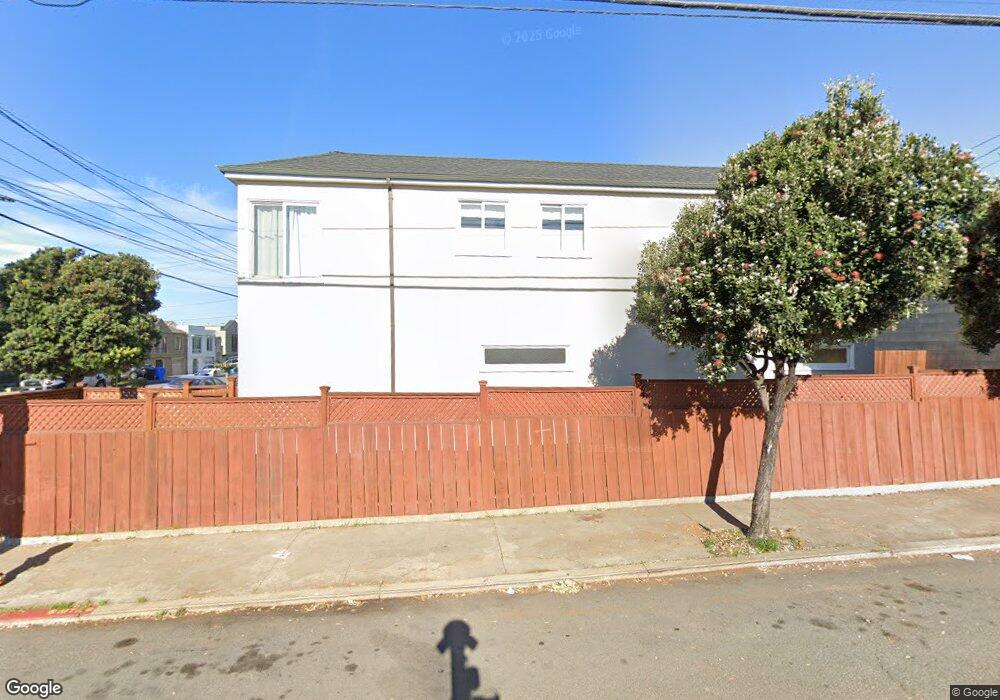
2182 47th Ave San Francisco, CA 94116
Outer Parkside NeighborhoodEstimated Value: $1,416,000 - $1,565,000
2
Beds
2
Baths
1,545
Sq Ft
$944/Sq Ft
Est. Value
About This Home
This home is located at 2182 47th Ave, San Francisco, CA 94116 and is currently estimated at $1,457,870, approximately $943 per square foot. 2182 47th Ave is a home located in San Francisco County with nearby schools including Sunset Elementary School, Giannini (A.P.) Middle School, and St. Gabriel School.
Ownership History
Date
Name
Owned For
Owner Type
Purchase Details
Closed on
Feb 18, 2003
Sold by
Wells Lurie Loris L
Bought by
Wells Lurie Loris L
Current Estimated Value
Home Financials for this Owner
Home Financials are based on the most recent Mortgage that was taken out on this home.
Original Mortgage
$322,700
Outstanding Balance
$137,599
Interest Rate
5.89%
Estimated Equity
$1,320,271
Purchase Details
Closed on
May 21, 2001
Sold by
Wells Lurie Loris L
Bought by
Wells Lurie Loris L
Purchase Details
Closed on
Dec 13, 2000
Sold by
Wells Lurie Loris L
Bought by
Wells Lurie Loris L
Home Financials for this Owner
Home Financials are based on the most recent Mortgage that was taken out on this home.
Original Mortgage
$340,000
Interest Rate
7.81%
Purchase Details
Closed on
Dec 4, 2000
Sold by
Gaw Milli
Bought by
Wells Lurie Loris L
Home Financials for this Owner
Home Financials are based on the most recent Mortgage that was taken out on this home.
Original Mortgage
$340,000
Interest Rate
7.81%
Create a Home Valuation Report for This Property
The Home Valuation Report is an in-depth analysis detailing your home's value as well as a comparison with similar homes in the area
Home Values in the Area
Average Home Value in this Area
Purchase History
| Date | Buyer | Sale Price | Title Company |
|---|---|---|---|
| Wells Lurie Loris L | -- | Old Republic Title Company | |
| Wells Lurie Loris L | -- | Old Republic Title Company | |
| Wells Lurie Loris L | -- | -- | |
| Wells Lurie Loris L | -- | Chicago Title Co | |
| Wells Lurie Loris L | $425,000 | Chicago Title Co |
Source: Public Records
Mortgage History
| Date | Status | Borrower | Loan Amount |
|---|---|---|---|
| Open | Wells Lurie Loris L | $322,700 | |
| Closed | Wells Lurie Loris L | $340,000 |
Source: Public Records
Tax History Compared to Growth
Tax History
| Year | Tax Paid | Tax Assessment Tax Assessment Total Assessment is a certain percentage of the fair market value that is determined by local assessors to be the total taxable value of land and additions on the property. | Land | Improvement |
|---|---|---|---|---|
| 2025 | $7,384 | $640,387 | $384,235 | $256,152 |
| 2024 | $7,384 | $627,831 | $376,701 | $251,130 |
| 2023 | $7,277 | $615,521 | $369,315 | $246,206 |
| 2022 | $7,148 | $603,453 | $362,074 | $241,379 |
| 2021 | $7,024 | $591,622 | $354,975 | $236,647 |
| 2020 | $7,045 | $585,557 | $351,336 | $234,221 |
| 2019 | $6,803 | $574,077 | $344,448 | $229,629 |
| 2018 | $6,575 | $562,822 | $337,695 | $225,127 |
| 2017 | $6,498 | $551,787 | $331,074 | $220,713 |
| 2016 | $6,376 | $540,969 | $324,583 | $216,386 |
| 2015 | $6,298 | $532,844 | $319,708 | $213,136 |
| 2014 | $6,131 | $522,407 | $313,446 | $208,961 |
Source: Public Records
Map
Nearby Homes
- 3622 Rivera St
- 3421 Rivera St
- 2026 Great Hwy
- 2142 43rd Ave
- 2115 42nd Ave
- 2395 44th Ave
- 1871 45th Ave
- 3917 Noriega St
- 3400 Vicente St
- 4108 Moraga St Unit 4110
- 2675 45th Ave
- 2687 45th Ave
- 3621 Moraga St
- 2274 36th Ave
- 1834 38th Ave
- 1580 Great Hwy Unit 4
- 1970 35th Ave
- 1586 44th Ave
- 1538 48th Ave
- 1563 43rd Ave