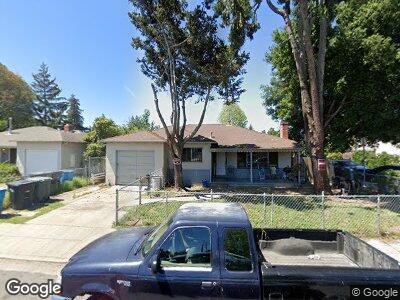
2185 Clarke Ave East Palo Alto, CA 94303
Estimated Value: $889,805 - $1,231,000
3
Beds
1
Bath
1,060
Sq Ft
$974/Sq Ft
Est. Value
About This Home
This home is located at 2185 Clarke Ave, East Palo Alto, CA 94303 and is currently estimated at $1,032,451, approximately $974 per square foot. 2185 Clarke Ave is a home located in San Mateo County with nearby schools including Brentwood Academy, Menlo-Atherton High School, and Aspire East Palo Alto Charter School.
Ownership History
Date
Name
Owned For
Owner Type
Purchase Details
Closed on
Feb 5, 2008
Sold by
Moore Victoria and Moore Willie
Bought by
Moore Victoria
Current Estimated Value
Home Financials for this Owner
Home Financials are based on the most recent Mortgage that was taken out on this home.
Original Mortgage
$278,000
Interest Rate
6.17%
Mortgage Type
New Conventional
Purchase Details
Closed on
Apr 20, 2006
Sold by
Torres Victoria A and Milton Victoria A Torres
Bought by
Torres Victoria A
Home Financials for this Owner
Home Financials are based on the most recent Mortgage that was taken out on this home.
Original Mortgage
$250,000
Interest Rate
6.29%
Mortgage Type
New Conventional
Purchase Details
Closed on
Nov 4, 2002
Sold by
Torres Victoria A
Bought by
Torres Victoria A and Milton Victoria A Torres
Create a Home Valuation Report for This Property
The Home Valuation Report is an in-depth analysis detailing your home's value as well as a comparison with similar homes in the area
Home Values in the Area
Average Home Value in this Area
Purchase History
| Date | Buyer | Sale Price | Title Company |
|---|---|---|---|
| Moore Victoria | -- | Fidelity National Title Co | |
| Torres Victoria A | -- | New Century Title Company | |
| Torres Victoria A | -- | -- |
Source: Public Records
Mortgage History
| Date | Status | Borrower | Loan Amount |
|---|---|---|---|
| Closed | Moore Victoria | $300,000 | |
| Closed | Moore Victoria | $278,000 | |
| Closed | Torres Victoria A | $250,000 | |
| Closed | Torres Victoria A | $150,000 |
Source: Public Records
Tax History Compared to Growth
Tax History
| Year | Tax Paid | Tax Assessment Tax Assessment Total Assessment is a certain percentage of the fair market value that is determined by local assessors to be the total taxable value of land and additions on the property. | Land | Improvement |
|---|---|---|---|---|
| 2023 | $2,272 | $49,561 | $10,541 | $39,020 |
| 2022 | $2,053 | $48,590 | $10,335 | $38,255 |
| 2021 | $2,007 | $47,638 | $10,133 | $37,505 |
| 2020 | $1,956 | $47,151 | $10,030 | $37,121 |
| 2019 | $1,955 | $46,228 | $9,834 | $36,394 |
| 2018 | $1,898 | $45,323 | $9,642 | $35,681 |
| 2017 | $1,843 | $44,435 | $9,453 | $34,982 |
| 2016 | $1,883 | $43,565 | $9,268 | $34,297 |
| 2015 | $1,874 | $42,911 | $9,129 | $33,782 |
| 2014 | $1,840 | $42,072 | $8,951 | $33,121 |
Source: Public Records
Map
Nearby Homes
- 1004 Garden St
- 2270 Brentwood Ct
- 1038 Runnymede St
- 1125 Cypress St
- 2281 Cooley Ave
- 1168 Beech St
- 2340 Cooley Ave
- 132 Maple Ln
- 867 Maple Place
- 2271 Euclid Ave
- 2389 Glen Way
- 2336 Palo Verde Ave
- 315 Garden St
- 119 Lotus Way
- 1885 E Bayshore Rd Unit 71
- 1885 E Bayshore Rd Unit 37
- 1885 E Bayshore Rd Unit 108
- 2154 Dumbarton Ave
- 159 Gardenia Way
- 108 Lotus Way