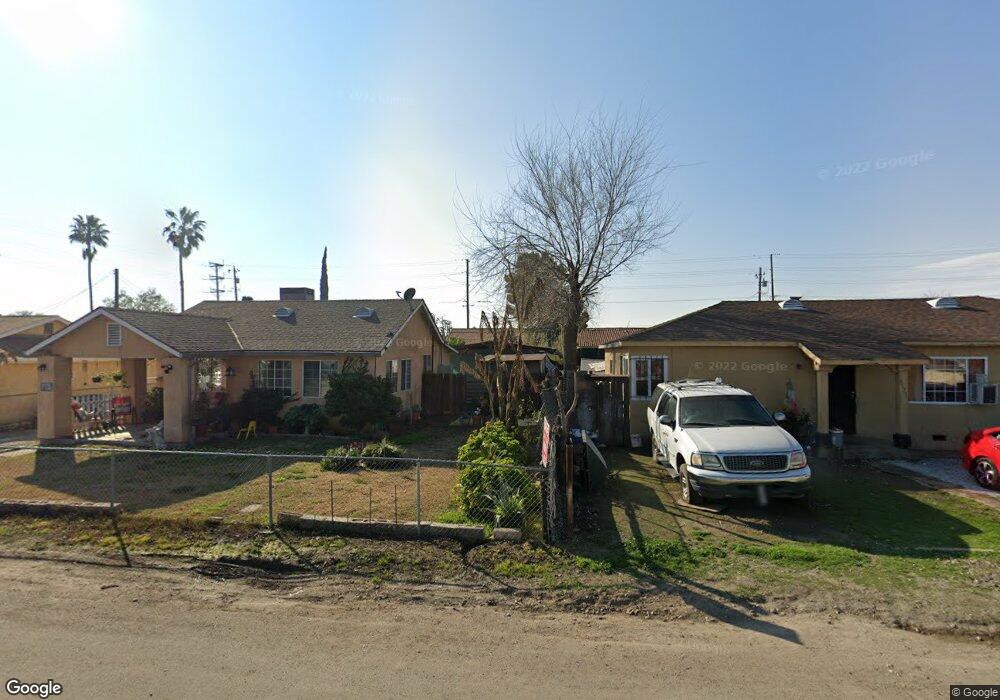
2185 S Laurel St Stockton, CA 95206
Kennedy NeighborhoodEstimated Value: $231,000 - $378,000
2
Beds
1
Bath
804
Sq Ft
$375/Sq Ft
Est. Value
About This Home
This home is located at 2185 S Laurel St, Stockton, CA 95206 and is currently estimated at $301,302, approximately $374 per square foot. 2185 S Laurel St is a home located in San Joaquin County with nearby schools including Alexander Hamilton Elementary, Monroe Elementary School, and Van Buren Elementary School.
Ownership History
Date
Name
Owned For
Owner Type
Purchase Details
Closed on
Nov 15, 2017
Sold by
Mendez Carlos Lopez and Lopez Carlos
Bought by
Mendez Carlos Lopez
Current Estimated Value
Home Financials for this Owner
Home Financials are based on the most recent Mortgage that was taken out on this home.
Original Mortgage
$84,000
Interest Rate
4.4%
Mortgage Type
New Conventional
Purchase Details
Closed on
Jan 2, 2004
Sold by
Lopez Filomeno
Bought by
Lopez Filomeno and Lopez Carlos
Purchase Details
Closed on
Oct 4, 2001
Sold by
Lopez Maria
Bought by
Lopez Filomeno
Home Financials for this Owner
Home Financials are based on the most recent Mortgage that was taken out on this home.
Original Mortgage
$96,300
Interest Rate
6.91%
Purchase Details
Closed on
Nov 28, 2000
Sold by
Cornelius Ramona and Estate Of Manuel O Hernandez
Bought by
Hancock Doug and Hancock Anna Liza
Create a Home Valuation Report for This Property
The Home Valuation Report is an in-depth analysis detailing your home's value as well as a comparison with similar homes in the area
Home Values in the Area
Average Home Value in this Area
Purchase History
| Date | Buyer | Sale Price | Title Company |
|---|---|---|---|
| Mendez Carlos Lopez | -- | Old Republic Title Company | |
| Mendez Carlos Lopez | -- | Old Republic Title Company | |
| Lopez Filomeno | -- | None Available | |
| Lopez Filomeno | -- | Chicago Title Co | |
| Lopez Filomeno | $107,000 | Chicago Title Co | |
| Hancock Doug | $33,000 | Central Valley Title Company |
Source: Public Records
Mortgage History
| Date | Status | Borrower | Loan Amount |
|---|---|---|---|
| Previous Owner | Mendez Carlos Lopez | $84,000 | |
| Previous Owner | Lopez Filomeno | $96,300 |
Source: Public Records
Tax History Compared to Growth
Tax History
| Year | Tax Paid | Tax Assessment Tax Assessment Total Assessment is a certain percentage of the fair market value that is determined by local assessors to be the total taxable value of land and additions on the property. | Land | Improvement |
|---|---|---|---|---|
| 2025 | $2,509 | $158,056 | $47,266 | $110,790 |
| 2024 | $2,123 | $154,958 | $46,340 | $108,618 |
| 2023 | $2,080 | $151,921 | $45,432 | $106,489 |
| 2022 | $2,068 | $148,943 | $44,542 | $104,401 |
| 2021 | $1,995 | $146,023 | $43,669 | $102,354 |
| 2020 | $1,915 | $144,527 | $43,222 | $101,305 |
| 2019 | $1,908 | $141,694 | $42,375 | $99,319 |
| 2018 | $2,115 | $138,917 | $41,545 | $97,372 |
| 2017 | $2,394 | $136,194 | $40,731 | $95,463 |
| 2016 | $2,409 | $133,524 | $39,932 | $93,592 |
| 2014 | $803 | $54,000 | $16,000 | $38,000 |
Source: Public Records
Map
Nearby Homes
- 2310 Scribner St
- 2121 Scribner St
- 1646 E 8th St
- 2041 Superior St
- 2128 Pock Ln
- 1651 E 6th St
- 1521 Spring St
- 1576 E 6th St
- 2278 E Loomis Rd
- 1711 Benedino Cir
- 2288 E Loomis Rd
- 2348 E Loomis Rd
- 2308 E Loomis Rd
- 2150 Michael Ave
- Plan 2541 at Parkside at Kennedy Ranch
- Plan 2308 Modeled at Parkside at Kennedy Ranch
- Plan 1934 Modeled at Parkside at Kennedy Ranch
- Plan 1718 at Parkside at Kennedy Ranch
- Plan 1481 Modeled at Parkside at Kennedy Ranch
- 2427 S Pilgrim St
- 2175 S Laurel St
- 2187 S Laurel St
- 2191 S Laurel St
- 2029 E 8th St
- 2151 S Laurel St
- 2195 S Laurel St
- 2176 S B St
- 2196 S B St
- 2147 S Laurel St
- 2005 E 8th St
- 2174 S B St
- 2168 S Laurel St
- 2168 S B St
- 2156 S Laurel St
- 2156 S B St
- 2150 S Laurel St
- 2143 S Laurel St
- 2022 E 8th St
- 2142 S Laurel St
- 2144 S B St