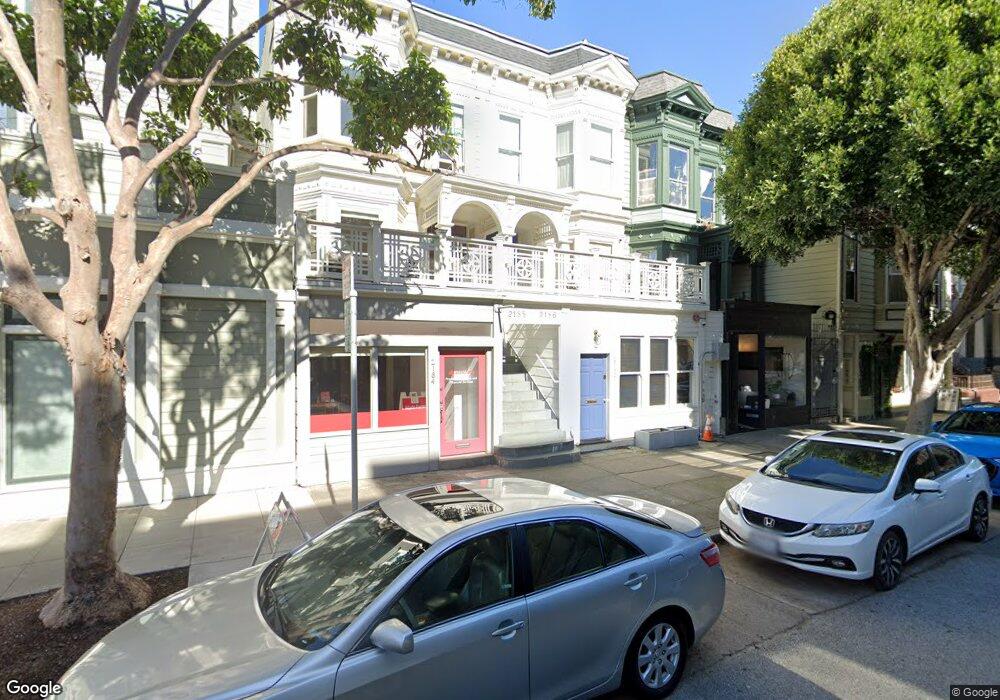
2188 Sutter St San Francisco, CA 94115
Lower Pacific Heights NeighborhoodEstimated Value: $1,759,000 - $2,302,000
3
Beds
3
Baths
2,281
Sq Ft
$878/Sq Ft
Est. Value
About This Home
This home is located at 2188 Sutter St, San Francisco, CA 94115 and is currently estimated at $2,001,867, approximately $877 per square foot. 2188 Sutter St is a home located in San Francisco County with nearby schools including Cobb (William L.) Elementary School, Roosevelt Middle School, and Creative Arts Charter School.
Ownership History
Date
Name
Owned For
Owner Type
Purchase Details
Closed on
Jan 22, 2007
Sold by
Dice Brian and Parry Kourtney
Bought by
Dice Brian D and Parry Kourtney B
Current Estimated Value
Purchase Details
Closed on
Oct 16, 2006
Sold by
Pirrone Christopher and Pirrone Jessica Lazarus
Bought by
Dice Brian and Parry Kourtney
Home Financials for this Owner
Home Financials are based on the most recent Mortgage that was taken out on this home.
Original Mortgage
$212,000
Outstanding Balance
$125,851
Interest Rate
6.46%
Mortgage Type
Stand Alone Second
Estimated Equity
$1,876,016
Create a Home Valuation Report for This Property
The Home Valuation Report is an in-depth analysis detailing your home's value as well as a comparison with similar homes in the area
Home Values in the Area
Average Home Value in this Area
Purchase History
| Date | Buyer | Sale Price | Title Company |
|---|---|---|---|
| Dice Brian D | -- | None Available | |
| Dice Brian | $1,060,000 | Old Republic Title Company | |
| Pirrone Christopher | -- | Old Republic Title Company |
Source: Public Records
Mortgage History
| Date | Status | Borrower | Loan Amount |
|---|---|---|---|
| Open | Pirrone Christopher | $212,000 | |
| Open | Dice Brian | $848,000 |
Source: Public Records
Tax History
| Year | Tax Paid | Tax Assessment Tax Assessment Total Assessment is a certain percentage of the fair market value that is determined by local assessors to be the total taxable value of land and additions on the property. | Land | Improvement |
|---|---|---|---|---|
| 2025 | $18,837 | $1,578,598 | $710,076 | $868,522 |
| 2024 | $18,837 | $1,547,648 | $696,154 | $851,494 |
| 2023 | $18,553 | $1,517,304 | $682,504 | $834,800 |
| 2022 | $18,199 | $1,487,569 | $669,127 | $818,442 |
| 2021 | $17,876 | $1,458,402 | $656,007 | $802,395 |
| 2020 | $17,955 | $1,443,449 | $649,281 | $794,168 |
| 2019 | $17,338 | $1,415,147 | $636,550 | $778,597 |
| 2018 | $16,753 | $1,387,400 | $624,069 | $763,331 |
| 2017 | $16,255 | $1,360,198 | $611,833 | $748,365 |
| 2016 | $14,416 | $1,199,674 | $599,837 | $599,837 |
| 2015 | $14,237 | $1,181,654 | $590,827 | $590,827 |
| 2014 | $13,860 | $1,158,508 | $579,254 | $579,254 |
Source: Public Records
Map
Nearby Homes
- 1880 Steiner St Unit 208
- 1844 Scott St
- 2075 Sutter St Unit 501
- 1945 Pierce St
- 2652 California St
- 2140 Bush St Unit 5
- 2678 Sacramento St
- 2654-2656 Bush St
- 2050 Divisadero St Unit 2
- 2854 Sacramento St
- 1326 Scott St Unit 32
- 1365 Scott St Unit 1
- 2870 Sacramento St
- 2070 Bush St
- 2020 Webster St
- 2132 Pine St
- 2112 Pine St Unit B
- 2100 Pine St
- 1550 Ofarrell St Unit 6
- 2020 Ellis St Unit 402
- 2186 Sutter St
- 2182 Sutter St
- 2184 Sutter St
- 2180 Sutter St
- 1722 Pierce St
- 2166 Sutter St Unit 2170
- 2154 Sutter St
- 2158 Sutter St
- 2156 Sutter St Unit 2156
- 1701 Pierce St Unit 3
- 1701 Pierce St Unit 2
- 1701 Pierce St Unit 1
- 2150 Sutter St
- 2181 Sutter St
- 2148 Sutter St Unit 2148
- 1736 Pierce St
- 1715 Pierce St Unit 3
- 1715 Pierce St Unit 2
- 1715 Pierce St Unit 1
- 2202 Sutter St Unit 3
Your Personal Tour Guide
Ask me questions while you tour the home.