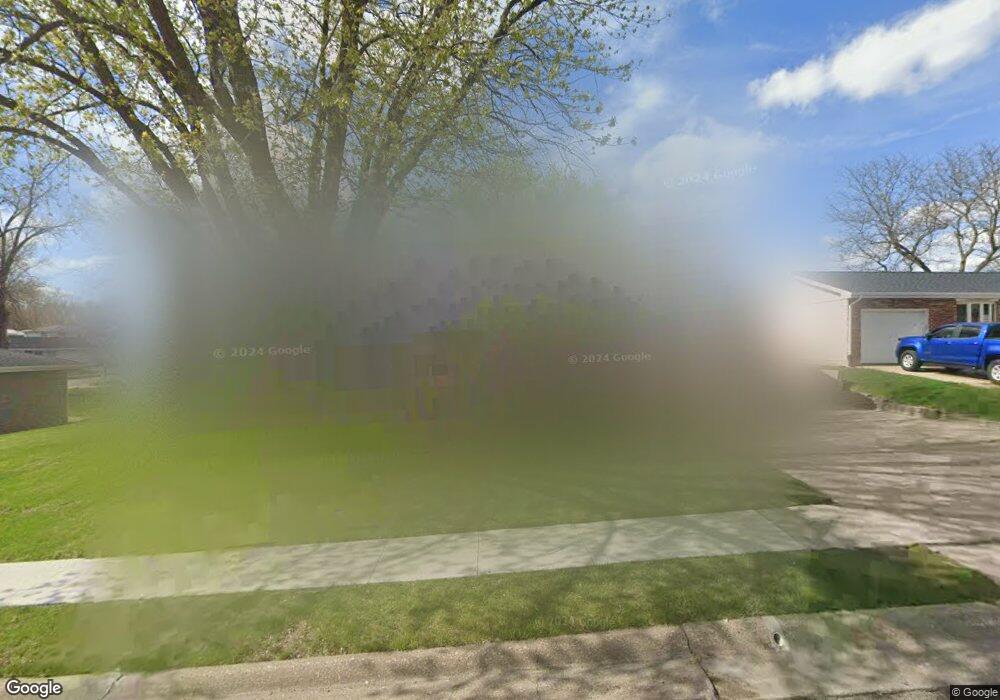
2189 Key Way Dubuque, IA 52002
Estimated Value: $235,000 - $278,000
3
Beds
2
Baths
1,638
Sq Ft
$158/Sq Ft
Est. Value
About This Home
This home is located at 2189 Key Way, Dubuque, IA 52002 and is currently estimated at $258,306, approximately $157 per square foot. 2189 Key Way is a home located in Dubuque County with nearby schools including John Kennedy Elementary School, Eleanor Roosevelt Middle School, and Hempstead High School.
Ownership History
Date
Name
Owned For
Owner Type
Purchase Details
Closed on
Jul 24, 2020
Sold by
Krapfl Joshua L and Krapfl Sherri A
Bought by
Williams Griffin
Current Estimated Value
Home Financials for this Owner
Home Financials are based on the most recent Mortgage that was taken out on this home.
Original Mortgage
$177,898
Outstanding Balance
$156,994
Interest Rate
3.2%
Mortgage Type
New Conventional
Estimated Equity
$101,312
Purchase Details
Closed on
Jun 26, 2008
Sold by
Davis Michael A and Davis Jacqueline M
Bought by
Krapfl Joshua L and Krapfl Sherri A
Home Financials for this Owner
Home Financials are based on the most recent Mortgage that was taken out on this home.
Original Mortgage
$139,000
Interest Rate
6.05%
Mortgage Type
Purchase Money Mortgage
Purchase Details
Closed on
Jun 5, 2007
Sold by
Puccio Donald B and Puccio Donald B
Bought by
Wells Fargo Bank Na
Create a Home Valuation Report for This Property
The Home Valuation Report is an in-depth analysis detailing your home's value as well as a comparison with similar homes in the area
Purchase History
| Date | Buyer | Sale Price | Title Company |
|---|---|---|---|
| Williams Griffin | $183,500 | None Available | |
| Krapfl Joshua L | $139,000 | None Available | |
| Wells Fargo Bank Na | $109,000 | None Available |
Source: Public Records
Mortgage History
| Date | Status | Borrower | Loan Amount |
|---|---|---|---|
| Open | Williams Griffin | $177,898 | |
| Previous Owner | Krapfl Joshua L | $139,000 |
Source: Public Records
Tax History
| Year | Tax Paid | Tax Assessment Tax Assessment Total Assessment is a certain percentage of the fair market value that is determined by local assessors to be the total taxable value of land and additions on the property. | Land | Improvement |
|---|---|---|---|---|
| 2025 | $2,920 | $231,100 | $45,300 | $185,800 |
| 2024 | $2,920 | $213,300 | $39,400 | $173,900 |
| 2023 | $2,856 | $215,100 | $39,400 | $175,700 |
| 2022 | $2,666 | $170,200 | $35,460 | $134,740 |
| 2021 | $2,666 | $170,200 | $35,460 | $134,740 |
| 2020 | $2,622 | $156,230 | $35,460 | $120,770 |
| 2019 | $2,532 | $156,230 | $35,460 | $120,770 |
| 2018 | $2,496 | $144,690 | $35,460 | $109,230 |
| 2017 | $2,460 | $145,000 | $35,460 | $109,540 |
| 2016 | $2,406 | $135,920 | $35,460 | $100,460 |
| 2015 | $2,406 | $135,920 | $35,460 | $100,460 |
| 2014 | $2,270 | $132,050 | $35,460 | $96,590 |
Source: Public Records
Map
Nearby Homes
- 2201 Del Monaco Dr
- 2191 Graham Cir
- 2315 Pasadena Dr
- 2281 Pasadena Dr
- 3349 Kaufmann Ave
- 2290 Theda Dr
- 3085 Lindale St
- 3085 Kaufmann Ave
- 3154 Erie Ct
- 2665 Marywood Dr
- 2995 Asbury Rd
- 2185 Broadlawn Rd
- 1723 Richie Dr
- 1718 Richie Dr
- 2035 Broadlawn Rd
- 2935 Saint Anne Dr
- 2930 Kane #1 St
- 1970 Admiral St
- 2935 Van Buren St
- 2685 Renaissance Dr
Your Personal Tour Guide
Ask me questions while you tour the home.