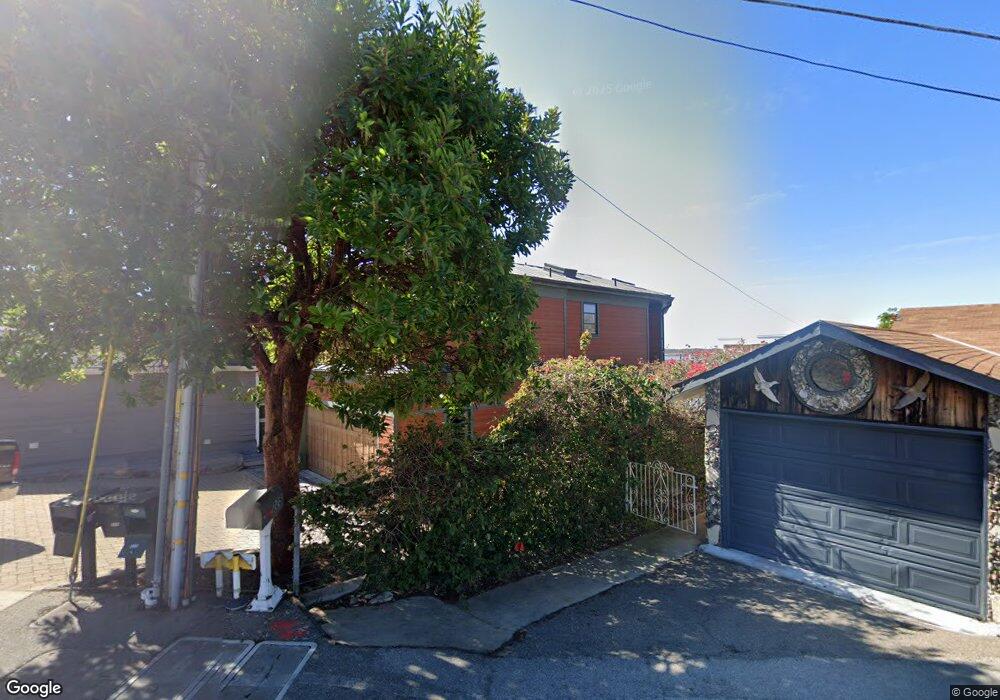
219 Main St Morro Bay, CA 93442
Estimated Value: $1,594,790 - $1,823,000
3
Beds
4
Baths
2,350
Sq Ft
$744/Sq Ft
Est. Value
About This Home
This home is located at 219 Main St, Morro Bay, CA 93442 and is currently estimated at $1,747,698, approximately $743 per square foot. 219 Main St is a home located in San Luis Obispo County with nearby schools including Del Mar Elementary School, Los Osos Middle School, and Morro Bay High School.
Ownership History
Date
Name
Owned For
Owner Type
Purchase Details
Closed on
Oct 27, 2017
Sold by
Vignovich Ceal M and Michael And Cealvignovich Trus
Bought by
Vignovich Ceal M and Vignovich Michael
Current Estimated Value
Purchase Details
Closed on
Dec 20, 2012
Sold by
Vignovich Michael R and Vignovich Ceal M
Bought by
Vignovich Michael R and Vignovich Ceal M
Home Financials for this Owner
Home Financials are based on the most recent Mortgage that was taken out on this home.
Original Mortgage
$825,000
Outstanding Balance
$568,891
Interest Rate
3.27%
Mortgage Type
New Conventional
Estimated Equity
$1,178,807
Purchase Details
Closed on
Oct 12, 2011
Sold by
Vignovich Michael R and Vignovich Ceal M
Bought by
Vignovich Michael R and Vignovich Ceal M
Purchase Details
Closed on
May 3, 2011
Sold by
Crizer Robert and Crizer Beth
Bought by
Vignovich Michael R and Vignovich Ceal M
Home Financials for this Owner
Home Financials are based on the most recent Mortgage that was taken out on this home.
Original Mortgage
$960,000
Interest Rate
5%
Mortgage Type
New Conventional
Create a Home Valuation Report for This Property
The Home Valuation Report is an in-depth analysis detailing your home's value as well as a comparison with similar homes in the area
Home Values in the Area
Average Home Value in this Area
Purchase History
| Date | Buyer | Sale Price | Title Company |
|---|---|---|---|
| Vignovich Ceal M | -- | None Available | |
| Vignovich Michael R | -- | Accommodation | |
| Vignovich Michael R | -- | Multiple | |
| Vignovich Michael R | -- | None Available | |
| Vignovich Michael R | $1,280,000 | Fidelity National Title Co |
Source: Public Records
Mortgage History
| Date | Status | Borrower | Loan Amount |
|---|---|---|---|
| Open | Vignovich Michael R | $825,000 | |
| Closed | Vignovich Michael R | $960,000 |
Source: Public Records
Tax History
| Year | Tax Paid | Tax Assessment Tax Assessment Total Assessment is a certain percentage of the fair market value that is determined by local assessors to be the total taxable value of land and additions on the property. | Land | Improvement |
|---|---|---|---|---|
| 2025 | $17,768 | $1,639,897 | $1,056,966 | $582,931 |
| 2024 | $17,447 | $1,607,743 | $1,036,242 | $571,501 |
| 2023 | $17,447 | $1,576,220 | $1,015,924 | $560,296 |
| 2022 | $16,353 | $1,545,314 | $996,004 | $549,310 |
| 2021 | $16,093 | $1,515,015 | $976,475 | $538,540 |
| 2020 | $15,928 | $1,499,481 | $966,463 | $533,018 |
| 2019 | $15,763 | $1,470,080 | $947,513 | $522,567 |
| 2018 | $15,454 | $1,441,256 | $928,935 | $512,321 |
| 2017 | $15,151 | $1,412,997 | $910,721 | $502,276 |
| 2016 | $14,854 | $1,385,292 | $892,864 | $492,428 |
| 2015 | $14,627 | $1,364,485 | $879,453 | $485,032 |
| 2014 | $13,431 | $1,337,757 | $862,226 | $475,531 |
Source: Public Records
Map
Nearby Homes
- 201 Main St
- 173 Sandpiper Ln
- 163 Sandpiper Ln
- 190 Main St Unit 25
- 436 Morro Ave
- 485 Morro Ave
- 245 Driftwood St
- 410 Kings Ave
- 444 Kings Ave
- 1000 Ridgeway St
- 240 Pacific St
- 600 Morro Bay Blvd Unit B
- 600 Morro Bay Blvd Unit 203
- 941 Marina St
- 731 Butte Ave
- 960 Las Tunas St
- 1111 Main St
- 1151 Main St
- 1187 Main St
- 1260 Main St
Your Personal Tour Guide
Ask me questions while you tour the home.