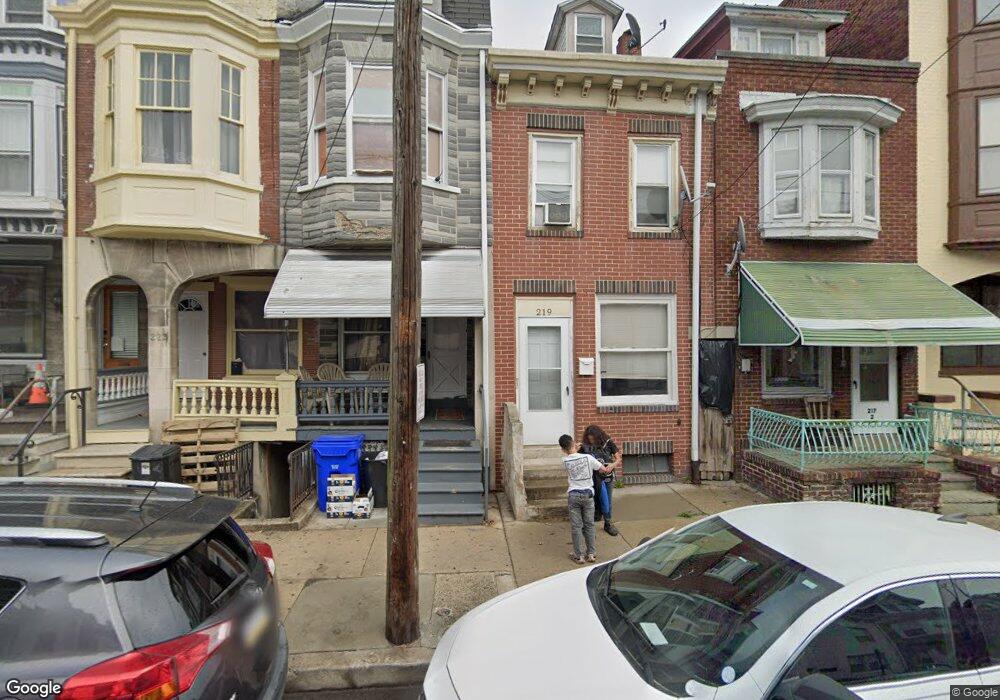
219 N 11th St Reading, PA 19601
Penn's Common NeighborhoodEstimated Value: $112,000 - $164,000
3
Beds
1
Bath
1,156
Sq Ft
$113/Sq Ft
Est. Value
About This Home
This home is located at 219 N 11th St, Reading, PA 19601 and is currently estimated at $131,000, approximately $113 per square foot. 219 N 11th St is a home located in Berks County with nearby schools including Tenth & Penn El School, Central Middle School, and Reading Senior High School.
Ownership History
Date
Name
Owned For
Owner Type
Purchase Details
Closed on
Feb 29, 2024
Sold by
E & A Development Llc
Bought by
Hardwick Real Estate Llc
Current Estimated Value
Home Financials for this Owner
Home Financials are based on the most recent Mortgage that was taken out on this home.
Original Mortgage
$166,812
Outstanding Balance
$163,746
Interest Rate
6.69%
Mortgage Type
New Conventional
Estimated Equity
-$32,746
Purchase Details
Closed on
Jun 20, 2008
Sold by
Leiby Donald H and Leiby Esther C
Bought by
E&A Development Llc
Create a Home Valuation Report for This Property
The Home Valuation Report is an in-depth analysis detailing your home's value as well as a comparison with similar homes in the area
Home Values in the Area
Average Home Value in this Area
Purchase History
| Date | Buyer | Sale Price | Title Company |
|---|---|---|---|
| Hardwick Real Estate Llc | $162,500 | None Listed On Document | |
| E&A Development Llc | $17,500 | Conestoga Title Insurance |
Source: Public Records
Mortgage History
| Date | Status | Borrower | Loan Amount |
|---|---|---|---|
| Open | Hardwick Real Estate Llc | $166,812 |
Source: Public Records
Tax History Compared to Growth
Tax History
| Year | Tax Paid | Tax Assessment Tax Assessment Total Assessment is a certain percentage of the fair market value that is determined by local assessors to be the total taxable value of land and additions on the property. | Land | Improvement |
|---|---|---|---|---|
| 2025 | $578 | $21,300 | $9,800 | $11,500 |
| 2024 | $946 | $21,300 | $9,800 | $11,500 |
| 2023 | $931 | $21,300 | $9,800 | $11,500 |
| 2022 | $931 | $21,300 | $9,800 | $11,500 |
| 2021 | $931 | $21,300 | $9,800 | $11,500 |
| 2020 | $922 | $21,300 | $9,800 | $11,500 |
| 2019 | $922 | $21,300 | $9,800 | $11,500 |
| 2018 | $922 | $21,300 | $9,800 | $11,500 |
| 2017 | $916 | $21,300 | $9,800 | $11,500 |
| 2016 | $523 | $21,300 | $9,800 | $11,500 |
| 2015 | $523 | $21,300 | $9,800 | $11,500 |
| 2014 | $481 | $21,300 | $9,800 | $11,500 |
Source: Public Records
Map
Nearby Homes