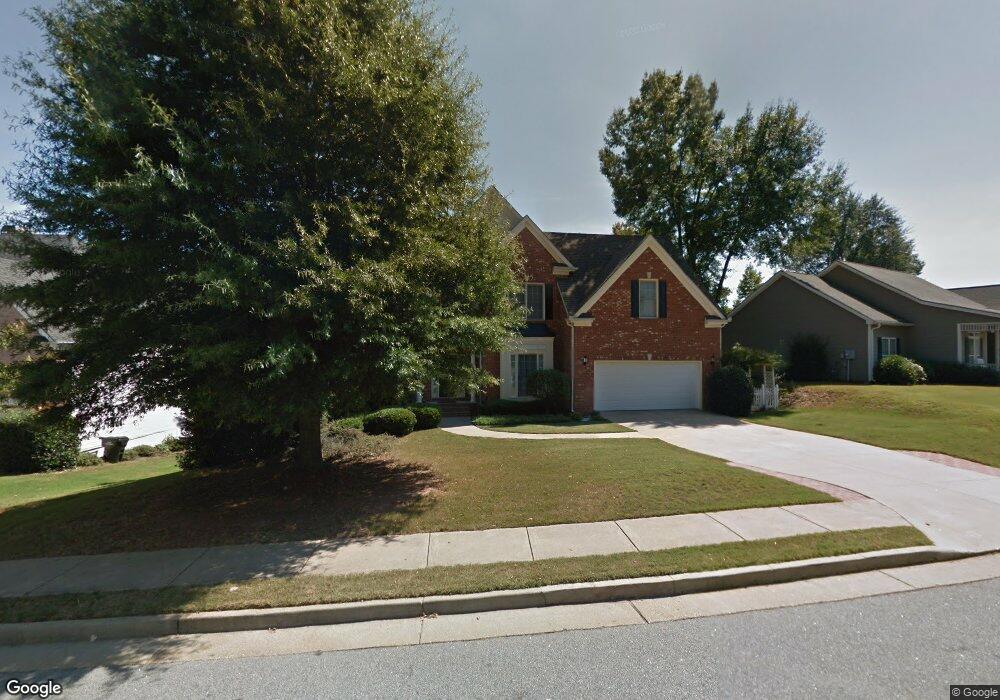
219 Olmstead Trace Newnan, GA 30263
Avery Park NeighborhoodEstimated Value: $440,241 - $495,000
5
Beds
3
Baths
3,200
Sq Ft
$146/Sq Ft
Est. Value
About This Home
This home is located at 219 Olmstead Trace, Newnan, GA 30263 and is currently estimated at $465,810, approximately $145 per square foot. 219 Olmstead Trace is a home located in Coweta County with nearby schools including Elm Street Elementary School, Evans Middle School, and Newnan High School.
Ownership History
Date
Name
Owned For
Owner Type
Purchase Details
Closed on
Aug 5, 2010
Sold by
Holden Keith
Bought by
Holden Keith and Holden Kim M
Current Estimated Value
Home Financials for this Owner
Home Financials are based on the most recent Mortgage that was taken out on this home.
Original Mortgage
$206,600
Outstanding Balance
$137,065
Interest Rate
4.61%
Mortgage Type
VA
Estimated Equity
$328,745
Purchase Details
Closed on
Apr 6, 2010
Sold by
Devine Paul L
Bought by
Bank Of Coweta
Purchase Details
Closed on
May 23, 2003
Sold by
Morrison Homes Inc
Bought by
Devine Paul L
Home Financials for this Owner
Home Financials are based on the most recent Mortgage that was taken out on this home.
Original Mortgage
$246,160
Interest Rate
5.79%
Purchase Details
Closed on
Dec 29, 1999
Sold by
Peachtree City Holdi
Bought by
Morrison Homes Of Fl
Purchase Details
Closed on
Aug 24, 1998
Bought by
Peachtree City Holdi
Create a Home Valuation Report for This Property
The Home Valuation Report is an in-depth analysis detailing your home's value as well as a comparison with similar homes in the area
Home Values in the Area
Average Home Value in this Area
Purchase History
| Date | Buyer | Sale Price | Title Company |
|---|---|---|---|
| Holden Keith | -- | -- | |
| Holden Keith | $200,000 | -- | |
| Bank Of Coweta | $230,611 | -- | |
| Devine Paul L | -- | -- | |
| Devine Paul L | $307,700 | -- | |
| Morrison Homes Of Fl | $716,100 | -- | |
| Peachtree City Holdi | $2,810,000 | -- |
Source: Public Records
Mortgage History
| Date | Status | Borrower | Loan Amount |
|---|---|---|---|
| Open | Holden Keith | $206,600 | |
| Previous Owner | Devine Paul L | $246,160 |
Source: Public Records
Tax History Compared to Growth
Tax History
| Year | Tax Paid | Tax Assessment Tax Assessment Total Assessment is a certain percentage of the fair market value that is determined by local assessors to be the total taxable value of land and additions on the property. | Land | Improvement |
|---|---|---|---|---|
| 2024 | $4,095 | $182,618 | $28,000 | $154,618 |
| 2023 | $4,095 | $164,874 | $24,000 | $140,874 |
| 2022 | $3,636 | $157,658 | $24,000 | $133,658 |
| 2021 | $3,219 | $126,632 | $14,000 | $112,632 |
| 2020 | $3,289 | $126,632 | $14,000 | $112,632 |
| 2019 | $2,944 | $116,308 | $14,000 | $102,308 |
| 2018 | $3,401 | $116,308 | $14,000 | $102,308 |
| 2017 | $2,922 | $115,333 | $14,000 | $101,333 |
| 2016 | $2,950 | $101,692 | $14,000 | $87,692 |
| 2015 | $2,838 | $97,795 | $14,000 | $83,795 |
| 2014 | $2,565 | $91,795 | $8,000 | $83,795 |
Source: Public Records
Map
Nearby Homes
- 19 Palladio Way
- 28 Vaux Way
- 87 Paxton Place
- 149 Westminster Way
- 88 Vaux Way
- 1015 Wahoo Hills
- 24 Overbrook Ct
- 8 Canterbury Dr
- 19 Harpers Farm Dr
- 156 N Square Ln
- 78 Bedford Park Dr
- 3 Casey Rd
- 7 Casey Rd
- 10 Evan Ct
- 2 Casey Rd
- 4 Casey Rd
- 6 Casey Rd
- 264 Baldwin Ct
- 367 Old Atlanta Hwy Unit LOT 4
- 371 Old Atlanta Hwy Unit LOT 5
- 211 Olmstead Trace Unit 72
- 211 Olmstead Trace
- 223 Olmstead Trace
- 209 Olmstead Trace
- 95 the Boulevard
- 95 The Blvd
- 218 Olmstead Trace
- 208 Olmstead Trace
- 203 Olmstead Trace
- 91 the Boulevard
- 202 Olmstead Trace
- 104 The Blvd
- 104 the Boulevard
- 10 Olmstead Park Ln
- 199 Olmstead Trace
- 0 Olmstead Trace Unit LOT 54
- 0 Olmstead Trace Unit LOT 54 3273155
- 0 Olmstead Trace Unit 8994980
- 0 Olmstead Trace Unit 3180127
- 0 Olmstead Trace Unit 3249805