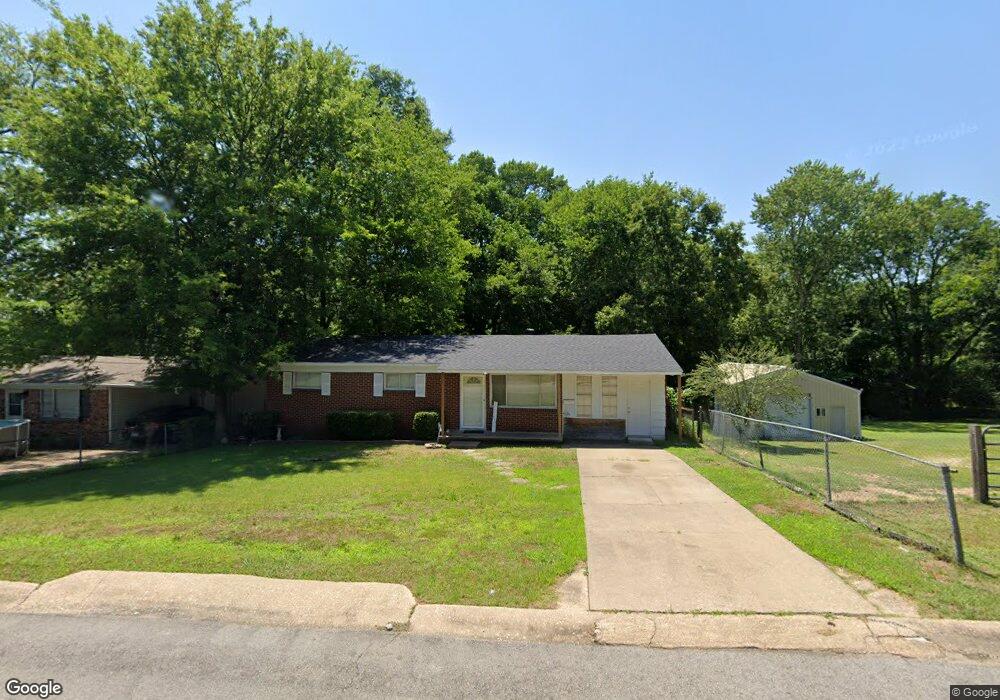
219 S 3rd St Benton, AR 72015
Estimated Value: $163,393 - $223,000
Studio
2
Baths
1,782
Sq Ft
$106/Sq Ft
Est. Value
About This Home
This home is located at 219 S 3rd St, Benton, AR 72015 and is currently estimated at $188,848, approximately $105 per square foot. 219 S 3rd St is a home located in Saline County with nearby schools including Angie Grant Elementary School, Benton Middle School, and Benton Junior High School.
Ownership History
Date
Name
Owned For
Owner Type
Purchase Details
Closed on
Jun 22, 2007
Sold by
Lytle Desiree and Lytle Mikchael D
Bought by
Burdick Kimberly
Current Estimated Value
Home Financials for this Owner
Home Financials are based on the most recent Mortgage that was taken out on this home.
Original Mortgage
$92,618
Outstanding Balance
$56,580
Interest Rate
6.16%
Mortgage Type
FHA
Estimated Equity
$132,268
Purchase Details
Closed on
May 18, 2007
Sold by
Olds Chad A
Bought by
Lytle Desiree and Fisher Desiree
Home Financials for this Owner
Home Financials are based on the most recent Mortgage that was taken out on this home.
Original Mortgage
$92,618
Outstanding Balance
$56,580
Interest Rate
6.16%
Mortgage Type
FHA
Estimated Equity
$132,268
Purchase Details
Closed on
Oct 31, 2005
Sold by
Olds Chad A
Bought by
Olds Chad A and Fisher Desiree
Purchase Details
Closed on
Jun 2, 2004
Bought by
Olds C
Purchase Details
Closed on
May 25, 2004
Bought by
Olds C
Purchase Details
Closed on
Aug 12, 2003
Bought by
Prater
Create a Home Valuation Report for This Property
The Home Valuation Report is an in-depth analysis detailing your home's value as well as a comparison with similar homes in the area
Home Values in the Area
Average Home Value in this Area
Purchase History
| Date | Buyer | Sale Price | Title Company |
|---|---|---|---|
| Burdick Kimberly | $94,000 | -- | |
| Lytle Desiree | -- | -- | |
| Olds Chad A | -- | -- | |
| Olds C | $72,000 | -- | |
| Olds C | $72,000 | -- | |
| Prater | $35,000 | -- |
Source: Public Records
Mortgage History
| Date | Status | Borrower | Loan Amount |
|---|---|---|---|
| Open | Burdick Kimberly | $92,618 |
Source: Public Records
Tax History
| Year | Tax Paid | Tax Assessment Tax Assessment Total Assessment is a certain percentage of the fair market value that is determined by local assessors to be the total taxable value of land and additions on the property. | Land | Improvement |
|---|---|---|---|---|
| 2025 | $1,391 | $26,644 | $3,000 | $23,644 |
| 2024 | $1,424 | $26,644 | $3,000 | $23,644 |
| 2023 | $906 | $26,644 | $3,000 | $23,644 |
| 2022 | $895 | $26,644 | $3,000 | $23,644 |
| 2021 | $835 | $21,840 | $2,000 | $19,840 |
| 2020 | $835 | $21,840 | $2,000 | $19,840 |
| 2019 | $835 | $21,840 | $2,000 | $19,840 |
| 2018 | $812 | $21,840 | $2,000 | $19,840 |
| 2017 | $759 | $21,840 | $2,000 | $19,840 |
| 2016 | $1,083 | $19,100 | $2,000 | $17,100 |
| 2015 | $714 | $19,100 | $2,000 | $17,100 |
| 2014 | $722 | $19,060 | $2,000 | $17,060 |
Source: Public Records
Map
Nearby Homes
Your Personal Tour Guide
Ask me questions while you tour the home.