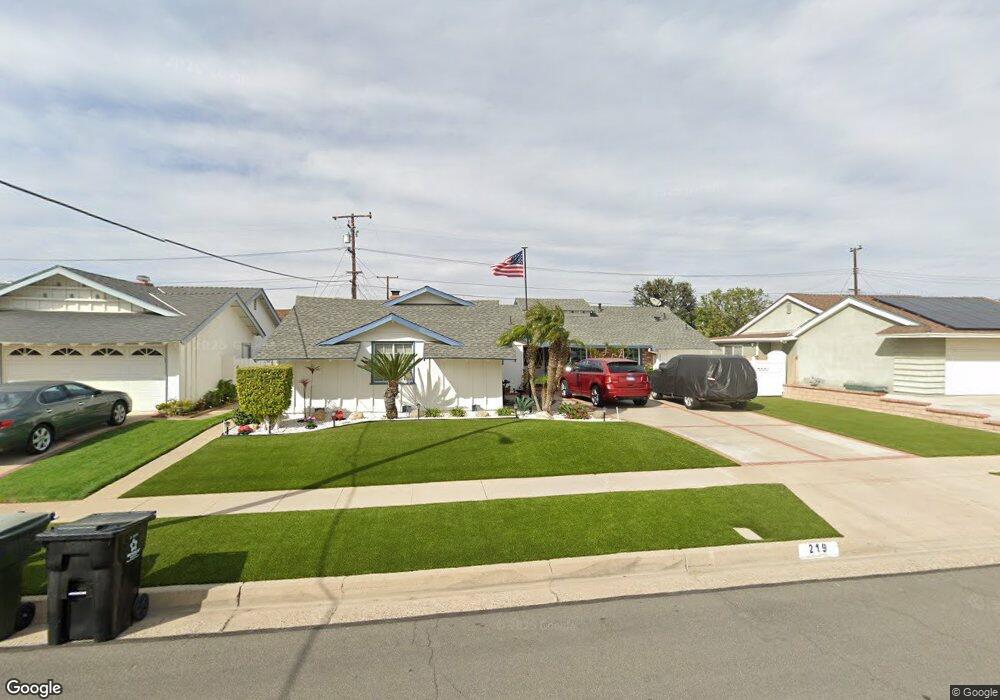
219 San Carlos Way Placentia, CA 92870
Estimated Value: $1,096,188 - $1,185,000
4
Beds
2
Baths
1,668
Sq Ft
$683/Sq Ft
Est. Value
About This Home
This home is located at 219 San Carlos Way, Placentia, CA 92870 and is currently estimated at $1,138,797, approximately $682 per square foot. 219 San Carlos Way is a home located in Orange County with nearby schools including Brookhaven Elementary School, Col. J. K. Tuffree Middle School, and El Dorado High School.
Ownership History
Date
Name
Owned For
Owner Type
Purchase Details
Closed on
Nov 20, 2015
Sold by
Mulder Harry G and Mulder Roberta E
Bought by
The Harry Gordon Mulder & Roberta Ernest
Current Estimated Value
Purchase Details
Closed on
Jan 26, 2005
Sold by
Mulder Harry G
Bought by
Mulder Harry G and Ballard Mulder Roberta E
Home Financials for this Owner
Home Financials are based on the most recent Mortgage that was taken out on this home.
Original Mortgage
$340,000
Outstanding Balance
$170,386
Interest Rate
5.74%
Mortgage Type
New Conventional
Estimated Equity
$968,411
Purchase Details
Closed on
Aug 12, 1996
Sold by
Krueger Henry R and Krueger Roberta R
Bought by
Mulder Harry G
Home Financials for this Owner
Home Financials are based on the most recent Mortgage that was taken out on this home.
Original Mortgage
$168,000
Interest Rate
8.23%
Create a Home Valuation Report for This Property
The Home Valuation Report is an in-depth analysis detailing your home's value as well as a comparison with similar homes in the area
Home Values in the Area
Average Home Value in this Area
Purchase History
| Date | Buyer | Sale Price | Title Company |
|---|---|---|---|
| The Harry Gordon Mulder & Roberta Ernest | -- | None Available | |
| Mulder Harry G | -- | Landsafe Title Cess Kearns | |
| Mulder Harry G | $210,000 | Landwood Title Company |
Source: Public Records
Mortgage History
| Date | Status | Borrower | Loan Amount |
|---|---|---|---|
| Open | Mulder Harry G | $340,000 | |
| Closed | Mulder Harry G | $168,000 |
Source: Public Records
Tax History
| Year | Tax Paid | Tax Assessment Tax Assessment Total Assessment is a certain percentage of the fair market value that is determined by local assessors to be the total taxable value of land and additions on the property. | Land | Improvement |
|---|---|---|---|---|
| 2025 | $4,361 | $342,011 | $225,511 | $116,500 |
| 2024 | $4,361 | $335,305 | $221,089 | $114,216 |
| 2023 | $4,253 | $328,731 | $216,754 | $111,977 |
| 2022 | $4,167 | $322,286 | $212,504 | $109,782 |
| 2021 | $4,047 | $315,967 | $208,337 | $107,630 |
| 2020 | $4,058 | $312,728 | $206,201 | $106,527 |
| 2019 | $3,889 | $306,597 | $202,158 | $104,439 |
| 2018 | $3,835 | $300,586 | $198,194 | $102,392 |
| 2017 | $3,768 | $294,693 | $194,308 | $100,385 |
| 2016 | $3,693 | $288,915 | $190,498 | $98,417 |
| 2015 | $3,642 | $284,576 | $187,637 | $96,939 |
| 2014 | $3,541 | $279,002 | $183,961 | $95,041 |
Source: Public Records
Map
Nearby Homes
- 109 Laurelwood Ave
- 1714 Sierra Bonita Dr
- 1719 Pecos River
- 308 Somerset Dr
- 2454 Beacon St
- 237 Bagnall Ave
- 1714 Saint James Place
- 408 Somerset Dr
- 320 Purdy Ave
- 230 Gila Way
- 1837 Kelleher Place
- 1819 Cambridge Ave
- 1525 Rogue St
- 206 Allegheny Cir
- 644 Sherwood Ave
- 455 Purdy Ave
- 2826 Lemonwood Ct
- 213 Appalachian Cir
- 2541 Thorn Place
- 3317 Topaz Ln
- 225 San Carlos Way
- 213 San Carlos Way
- 220 Juanita Way
- 226 Juanita Way
- 214 Juanita Way
- 231 San Carlos Way
- 207 San Carlos Way
- 220 San Carlos Way
- 232 Juanita Way
- 226 San Carlos Way
- 214 San Carlos Way
- 208 Juanita Way
- 237 San Carlos Way
- 232 San Carlos Way
- 238 Juanita Way
- 208 San Carlos Way
- 201 San Carlos Way
- 219 Juanita Way
- 202 Juanita Way
- 238 San Carlos Way
Your Personal Tour Guide
Ask me questions while you tour the home.