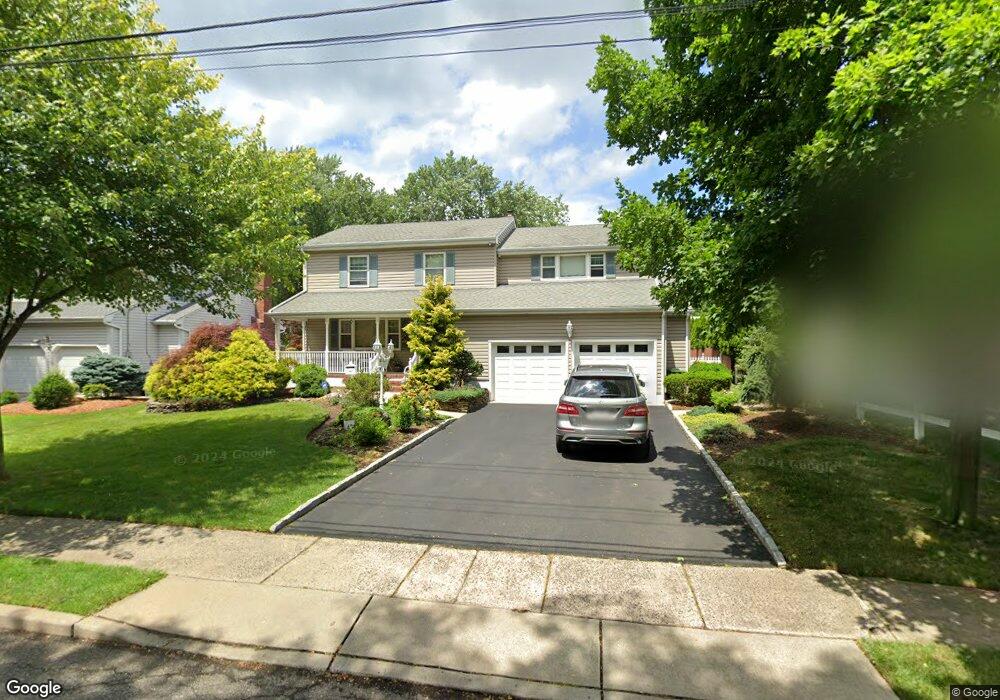
219 Taylor Rd Paramus, NJ 07652
Estimated Value: $960,892 - $1,247,000
Studio
--
Bath
2,390
Sq Ft
$449/Sq Ft
Est. Value
About This Home
This home is located at 219 Taylor Rd, Paramus, NJ 07652 and is currently estimated at $1,072,473, approximately $448 per square foot. 219 Taylor Rd is a home located in Bergen County with nearby schools including Paramus High School and David Gregory School.
Ownership History
Date
Name
Owned For
Owner Type
Purchase Details
Closed on
Jul 1, 2024
Sold by
Kojoian Rosine and Kojoian John
Bought by
Kojoian John and Kojoian Diana Tavitian
Current Estimated Value
Purchase Details
Closed on
May 20, 2008
Sold by
Kang Bernard and Kang Christine U
Bought by
Kojoian Jacques and Kojoian Rosine
Purchase Details
Closed on
Aug 1, 2006
Sold by
Rettenmaier Roy Henry
Bought by
Kang Christine U
Home Financials for this Owner
Home Financials are based on the most recent Mortgage that was taken out on this home.
Original Mortgage
$650,400
Interest Rate
6.83%
Purchase Details
Closed on
Nov 1, 1995
Sold by
Lefkowitz Charlotte
Bought by
Rettenmaier Roy
Home Financials for this Owner
Home Financials are based on the most recent Mortgage that was taken out on this home.
Original Mortgage
$28,000
Interest Rate
7.58%
Create a Home Valuation Report for This Property
The Home Valuation Report is an in-depth analysis detailing your home's value as well as a comparison with similar homes in the area
Home Values in the Area
Average Home Value in this Area
Purchase History
| Date | Buyer | Sale Price | Title Company |
|---|---|---|---|
| Kojoian John | -- | None Listed On Document | |
| Kojoian John | -- | None Listed On Document | |
| Kojoian Jacques | $820,000 | -- | |
| Kang Christine U | $813,000 | -- | |
| Rettenmaier Roy | $335,000 | -- |
Source: Public Records
Mortgage History
| Date | Status | Borrower | Loan Amount |
|---|---|---|---|
| Previous Owner | Kang Christine U | $650,400 | |
| Previous Owner | Rettenmaier Roy | $28,000 |
Source: Public Records
Tax History
| Year | Tax Paid | Tax Assessment Tax Assessment Total Assessment is a certain percentage of the fair market value that is determined by local assessors to be the total taxable value of land and additions on the property. | Land | Improvement |
|---|---|---|---|---|
| 2025 | $11,388 | $801,100 | $431,300 | $369,800 |
| 2024 | $11,097 | $752,200 | $398,800 | $353,400 |
| 2023 | $11,097 | $723,400 | $381,300 | $342,100 |
| 2022 | $10,527 | $678,300 | $355,000 | $323,300 |
| 2021 | $9,483 | $618,600 | $320,000 | $298,600 |
| 2020 | $9,739 | $610,600 | $315,000 | $295,600 |
| 2019 | $9,787 | $527,300 | $281,600 | $245,700 |
| 2018 | $9,665 | $527,300 | $281,600 | $245,700 |
| 2017 | $9,497 | $527,300 | $281,600 | $245,700 |
| 2016 | $9,238 | $527,300 | $281,600 | $245,700 |
| 2015 | $9,143 | $527,300 | $281,600 | $245,700 |
| 2014 | $9,064 | $527,300 | $281,600 | $245,700 |
Source: Public Records
Map
Nearby Homes
- 6 Merrimack Ct
- 461 Arthur Terrace
- 261 Idaho St
- 216 E Midland Ave
- 277 Columbia Terrace
- 360 Valley View Ave
- 624 West Dr
- 375 Burnet Place
- 623 Alberta Dr
- 90 Arnot Place
- 368 Elmwood Dr
- 319 Franklin Place
- 121 Circle Dr
- 362 Harrison St
- 105 Circle Dr
- 327 E Midland Ave
- 333 Harrison St
- 645 Cambridge Rd
- 311 N Farview Ave
- 492 Oaktree Rd
- 217 Taylor Rd
- 223 Taylor Rd
- 358 Mckinley Blvd
- 213 Taylor Rd
- 227 Taylor Rd
- 360 Mckinley Blvd
- 354 Mckinley Blvd
- 220 Taylor Rd
- 364 Mckinley Blvd
- 224 Taylor Rd
- 218 Taylor Rd
- 350 Mckinley Blvd
- 515 Berry Ln
- 211 Taylor Rd
- 214 Taylor Rd
- 228 Taylor Rd
- 523 Berry Ln
- 210 Taylor Rd
- 509 Berry Ln
- 219 Sweetbriar Place
Your Personal Tour Guide
Ask me questions while you tour the home.