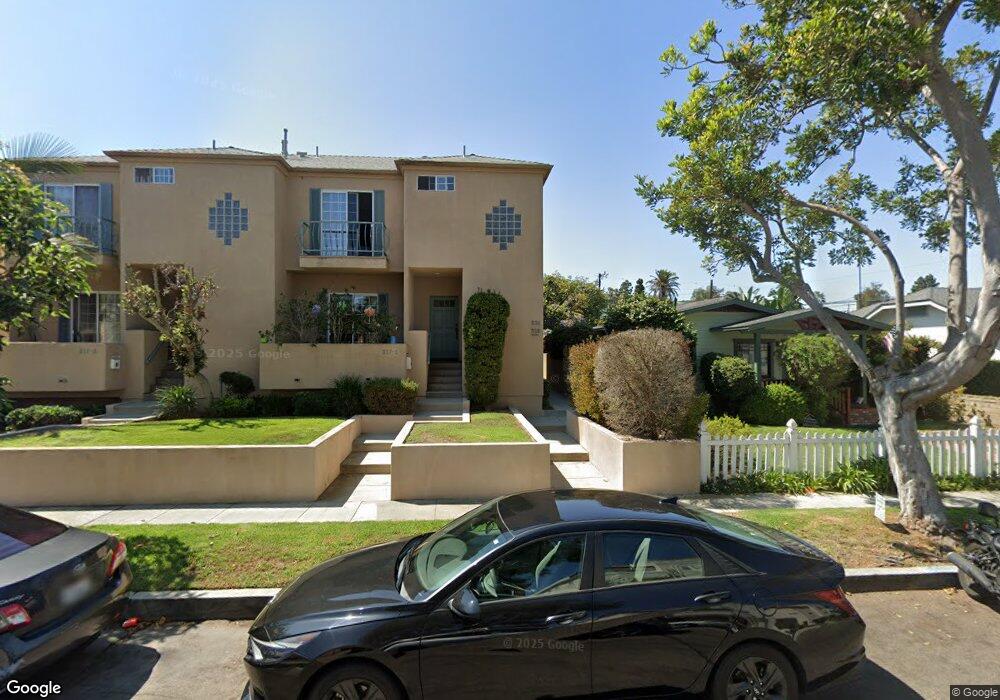
219 Whiting St Unit 2 El Segundo, CA 90245
Estimated Value: $1,189,703 - $1,444,000
3
Beds
4
Baths
1,646
Sq Ft
$782/Sq Ft
Est. Value
About This Home
This home is located at 219 Whiting St Unit 2, El Segundo, CA 90245 and is currently estimated at $1,286,926, approximately $781 per square foot. 219 Whiting St Unit 2 is a home located in Los Angeles County with nearby schools including Richmond Street Elementary School, El Segundo Middle School, and El Segundo High School.
Ownership History
Date
Name
Owned For
Owner Type
Purchase Details
Closed on
Dec 11, 2001
Sold by
Burns Anthony J
Bought by
Fitzgerald David A
Current Estimated Value
Home Financials for this Owner
Home Financials are based on the most recent Mortgage that was taken out on this home.
Original Mortgage
$296,000
Outstanding Balance
$117,208
Interest Rate
6.75%
Estimated Equity
$1,169,718
Purchase Details
Closed on
Jul 30, 1998
Sold by
Tomasello Mike R
Bought by
Burns Anthony J
Home Financials for this Owner
Home Financials are based on the most recent Mortgage that was taken out on this home.
Original Mortgage
$265,500
Interest Rate
6.62%
Purchase Details
Closed on
Dec 13, 1993
Sold by
Goldstein Arnold D
Bought by
Tomasello Mike R and Tomasello Jeri
Home Financials for this Owner
Home Financials are based on the most recent Mortgage that was taken out on this home.
Original Mortgage
$200,000
Interest Rate
7.16%
Create a Home Valuation Report for This Property
The Home Valuation Report is an in-depth analysis detailing your home's value as well as a comparison with similar homes in the area
Home Values in the Area
Average Home Value in this Area
Purchase History
| Date | Buyer | Sale Price | Title Company |
|---|---|---|---|
| Fitzgerald David A | $370,000 | -- | |
| Burns Anthony J | $295,000 | Southland Title Company | |
| Tomasello Mike R | $250,000 | Chicago Title Insurance Co |
Source: Public Records
Mortgage History
| Date | Status | Borrower | Loan Amount |
|---|---|---|---|
| Open | Fitzgerald David A | $296,000 | |
| Previous Owner | Burns Anthony J | $265,500 | |
| Previous Owner | Tomasello Mike R | $200,000 | |
| Closed | Fitzgerald David A | $37,000 |
Source: Public Records
Tax History
| Year | Tax Paid | Tax Assessment Tax Assessment Total Assessment is a certain percentage of the fair market value that is determined by local assessors to be the total taxable value of land and additions on the property. | Land | Improvement |
|---|---|---|---|---|
| 2025 | $6,117 | $546,581 | $318,939 | $227,642 |
| 2024 | $6,117 | $535,865 | $312,686 | $223,179 |
| 2023 | $5,959 | $525,358 | $306,555 | $218,803 |
| 2022 | $6,024 | $515,058 | $300,545 | $214,513 |
| 2021 | $5,934 | $504,959 | $294,652 | $210,307 |
| 2019 | $5,732 | $489,983 | $285,913 | $204,070 |
| 2018 | $5,383 | $480,376 | $280,307 | $200,069 |
| 2016 | $5,219 | $461,724 | $269,423 | $192,301 |
| 2015 | $5,154 | $454,790 | $265,377 | $189,413 |
| 2014 | $5,048 | $445,882 | $260,179 | $185,703 |
Source: Public Records
Map
Nearby Homes
- 328 Virginia St Unit 4
- 408 Loma Vista St
- 355 Hillcrest St
- 627 W Pine Ave
- 412 Richmond St
- 211 E Pine Ave
- 228 Arena St Unit B
- 228 Arena St Unit A
- 724 Loma Vista St
- 226 Arena St Unit B
- 226 Arena St
- 701 Hillcrest St
- 221 Sheldon St
- 745 Main St
- 804 Hillcrest St
- 529 Sierra Place
- 329 E Maple Ave
- 432 Lomita St
- 121 E Walnut Ave
- 219 W Acacia Ave
- 219 Whiting St Unit 1
- 215 Whiting St Unit 3
- 215 Whiting St Unit 2
- 215 Whiting St Unit 1
- 213 Whiting St Unit 1
- 213 Whiting St Unit 2
- 217 Whiting St Unit 2
- 217 Whiting St Unit 1
- 221 Whiting St Unit ST2
- 221 Whiting St Unit 2
- 221 Whiting St Unit 1
- 211 Whiting St
- 225 Whiting St Unit Guest House
- 225 Whiting St
- 229 Whiting St
- 216 Loma Vista St Unit G
- 216 Loma Vista St Unit F
- 216 Loma Vista St Unit E
- 216 Loma Vista St Unit A
- 216 Loma Vista St Unit B
Your Personal Tour Guide
Ask me questions while you tour the home.