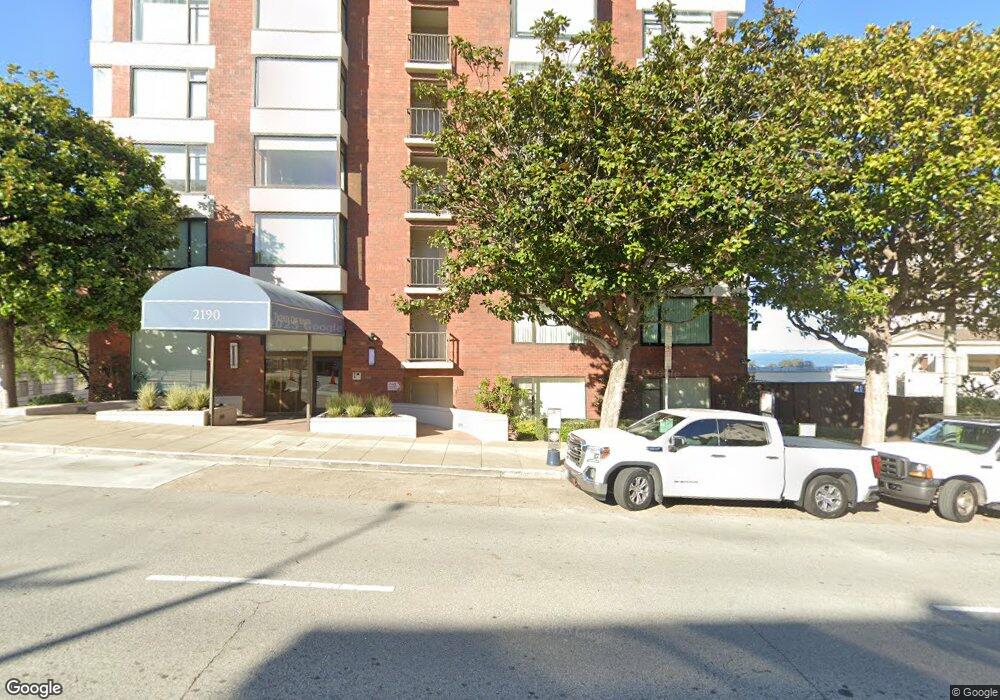
2190 Broadway St Unit 1E San Francisco, CA 94115
Pacific Heights NeighborhoodEstimated Value: $3,166,000 - $3,767,654
3
Beds
4
Baths
2,327
Sq Ft
$1,511/Sq Ft
Est. Value
About This Home
This home is located at 2190 Broadway St Unit 1E, San Francisco, CA 94115 and is currently estimated at $3,517,164, approximately $1,511 per square foot. 2190 Broadway St Unit 1E is a home located in San Francisco County with nearby schools including Sherman Elementary, Marina Middle School, and Mary L. Booker Leadership Academy.
Ownership History
Date
Name
Owned For
Owner Type
Purchase Details
Closed on
Feb 23, 2015
Sold by
Fields Gary B and Fields Marjorie N
Bought by
Bryson David R and Bryson Theresa Kwack
Current Estimated Value
Home Financials for this Owner
Home Financials are based on the most recent Mortgage that was taken out on this home.
Original Mortgage
$1,670,000
Outstanding Balance
$1,266,705
Interest Rate
3.5%
Mortgage Type
Adjustable Rate Mortgage/ARM
Estimated Equity
$2,250,459
Purchase Details
Closed on
Dec 8, 2011
Sold by
Winkel A Lynn
Bought by
Fields Gary B and Fields Marjorie N
Purchase Details
Closed on
Jul 16, 2003
Sold by
Winkel A Lynn
Bought by
Winkel A Lynn and A Lynn Winkel 1997 Trust
Purchase Details
Closed on
Feb 8, 1996
Sold by
Winkel A Lynn
Bought by
Winkel A Lynn
Purchase Details
Closed on
Oct 3, 1995
Sold by
Winkel Victor Wade and Lynn Winkel A
Bought by
Winkel A Lynn
Create a Home Valuation Report for This Property
The Home Valuation Report is an in-depth analysis detailing your home's value as well as a comparison with similar homes in the area
Home Values in the Area
Average Home Value in this Area
Purchase History
| Date | Buyer | Sale Price | Title Company |
|---|---|---|---|
| Bryson David R | $2,800,000 | Fidelity National Title | |
| Fields Gary B | $2,317,000 | First American Title Company | |
| Winkel A Lynn | -- | -- | |
| Winkel A Lynn | -- | -- | |
| Winkel A Lynn | -- | -- | |
| Winkel A Lynn | -- | -- |
Source: Public Records
Mortgage History
| Date | Status | Borrower | Loan Amount |
|---|---|---|---|
| Open | Bryson David R | $1,670,000 |
Source: Public Records
Tax History Compared to Growth
Tax History
| Year | Tax Paid | Tax Assessment Tax Assessment Total Assessment is a certain percentage of the fair market value that is determined by local assessors to be the total taxable value of land and additions on the property. | Land | Improvement |
|---|---|---|---|---|
| 2025 | $38,712 | $3,365,172 | $1,682,586 | $1,682,586 |
| 2024 | $38,712 | $3,299,190 | $1,649,595 | $1,649,595 |
| 2023 | $38,145 | $3,234,500 | $1,617,250 | $1,617,250 |
| 2022 | $37,460 | $3,171,080 | $1,585,540 | $1,585,540 |
| 2021 | $36,812 | $3,108,902 | $1,554,451 | $1,554,451 |
| 2020 | $36,925 | $3,077,026 | $1,538,513 | $1,538,513 |
| 2019 | $36,259 | $3,016,694 | $1,508,347 | $1,508,347 |
| 2018 | $35,035 | $2,957,544 | $1,478,772 | $1,478,772 |
| 2017 | $34,323 | $2,899,554 | $1,449,777 | $1,449,777 |
| 2016 | $33,812 | $2,842,700 | $1,421,350 | $1,421,350 |
| 2015 | $29,000 | $2,421,248 | $1,210,624 | $1,210,624 |
| 2014 | $28,235 | $2,373,820 | $1,186,910 | $1,186,910 |
Source: Public Records
Map
Nearby Homes
- 2190 Broadway St Unit 1W
- 2160 Vallejo St
- 2200 Pacific Ave Unit 8E
- 2040 Broadway St Unit 102
- 2755 Fillmore St
- 2100 Green St Unit 206
- 2198 Jackson St
- 1998 Vallejo St Unit 2
- 2467 Pacific Ave
- 1971 Broadway
- 1940 Broadway Unit 2W
- 2500 Steiner St Unit 3
- 2016 Pacific Ave Unit 201
- 2218 Clay St
- 3110 Buchanan St
- 1776 Green St Unit 201
- 2121 Webster St Unit GPH1
- 2539 Clay St Unit 1
- 2384 Union St
- 35 Moulton St Unit 2
- 2190 Broadway St Unit PH
- 2190 Broadway St Unit 9W
- 2190 Broadway St Unit 4E
- 2190 Broadway St Unit 7E
- 2190 Broadway St Unit 6W
- 2190 Broadway St Unit 6E
- 2190 Broadway St Unit 5W
- 2190 Broadway St Unit 5E
- 2190 Broadway St Unit 4W
- 2190 Broadway St Unit 3W
- 2190 Broadway St Unit 3E
- 2190 Broadway St Unit 2E
- 2190 Broadway St Unit 12W
- 2190 Broadway St Unit 11W
- 2190 Broadway St Unit 11E
- 2190 Broadway St Unit 10W
- 2190 Broadway St Unit 10E
- 2190 Broadway St Unit 9E
- 2190 Broadway St Unit 8W
- 2190 Broadway St Unit 8E