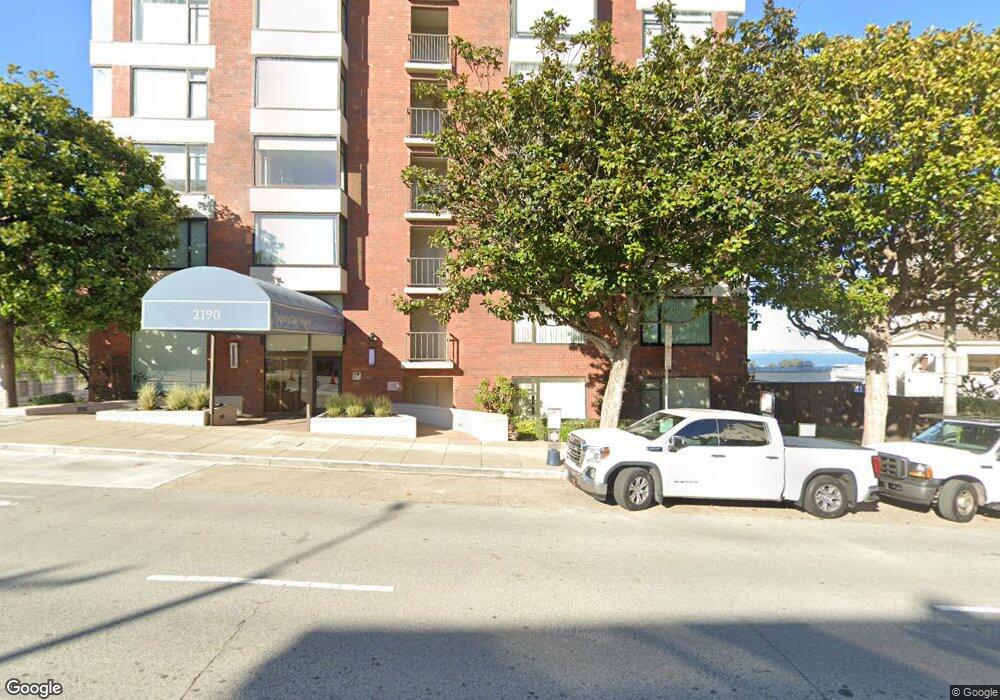
2190 Broadway St Unit 8E San Francisco, CA 94115
Pacific Heights NeighborhoodEstimated Value: $4,574,228 - $5,115,000
3
Beds
3
Baths
3,200
Sq Ft
$1,499/Sq Ft
Est. Value
About This Home
This home is located at 2190 Broadway St Unit 8E, San Francisco, CA 94115 and is currently estimated at $4,797,557, approximately $1,499 per square foot. 2190 Broadway St Unit 8E is a home located in San Francisco County with nearby schools including Sherman Elementary, Marina Middle School, and Mary L. Booker Leadership Academy.
Ownership History
Date
Name
Owned For
Owner Type
Purchase Details
Closed on
Sep 28, 2018
Sold by
Chong Curtis and The Antonio And Fannie Chong 1
Bought by
Chong Curtis and Flc Revocable Trust
Current Estimated Value
Purchase Details
Closed on
Sep 27, 2018
Sold by
Martin Chong Curtis and Martin Chong Richard
Bought by
Rayal Llc
Purchase Details
Closed on
Sep 26, 2018
Sold by
Chong Curtis and Chong Richard Martin
Bought by
Chong Curtis and Chong Richard Martin
Purchase Details
Closed on
Dec 19, 2012
Sold by
Chong Fannie L
Bought by
Chong Curtis and Chong Richard Martin
Purchase Details
Closed on
Nov 30, 2000
Sold by
Chong Fannie L
Bought by
Chong Fannie L
Purchase Details
Closed on
Jan 5, 2000
Sold by
Fannie L 1992 Revocable Trust The and Fannie L
Bought by
Chong Fannie L
Purchase Details
Closed on
Oct 12, 1998
Sold by
Revocabl Chong Antonio T and 1992 Fannie L
Bought by
Chong Fannie L and Atc Irrevocable By Pass Trust
Create a Home Valuation Report for This Property
The Home Valuation Report is an in-depth analysis detailing your home's value as well as a comparison with similar homes in the area
Home Values in the Area
Average Home Value in this Area
Purchase History
| Date | Buyer | Sale Price | Title Company |
|---|---|---|---|
| Chong Curtis | -- | None Available | |
| Rayal Llc | $4,656,000 | Chicago Title Co Concord | |
| Chong Curtis | -- | None Available | |
| Chong Curtis | -- | None Available | |
| Chong Fannie L | -- | -- | |
| Chong Fannie L | -- | -- | |
| Chong Fannie L | -- | -- |
Source: Public Records
Tax History Compared to Growth
Tax History
| Year | Tax Paid | Tax Assessment Tax Assessment Total Assessment is a certain percentage of the fair market value that is determined by local assessors to be the total taxable value of land and additions on the property. | Land | Improvement |
|---|---|---|---|---|
| 2025 | $63,990 | $5,500,052 | $2,856,388 | $2,643,664 |
| 2024 | $63,990 | $5,392,209 | $2,800,381 | $2,591,828 |
| 2023 | $63,049 | $5,286,481 | $2,745,472 | $2,541,009 |
| 2022 | $61,898 | $5,182,826 | $2,691,640 | $2,491,186 |
| 2021 | $58,529 | $4,887,478 | $2,638,863 | $2,248,615 |
| 2020 | $54,796 | $4,504,500 | $2,704,500 | $1,800,000 |
| 2019 | $55,733 | $4,655,625 | $2,560,594 | $2,095,031 |
| 2018 | $18,920 | $1,564,269 | $555,045 | $1,009,224 |
| 2017 | $18,400 | $1,533,600 | $544,163 | $989,437 |
| 2016 | $18,107 | $1,503,533 | $533,495 | $970,038 |
| 2015 | $17,917 | $1,480,952 | $525,483 | $955,469 |
| 2014 | $17,446 | $1,451,945 | $515,191 | $936,754 |
Source: Public Records
Map
Nearby Homes
- 2190 Broadway St Unit 1W
- 2160 Vallejo St
- 2040 Broadway St Unit 102
- 2100 Green St Unit 206
- 2200 Pacific Ave Unit 8E
- 2755 Fillmore St
- 2198 Jackson St
- 1998 Vallejo St Unit 2
- 1971 Broadway
- 2467 Pacific Ave
- 1940 Broadway Unit 2W
- 2016 Pacific Ave Unit 201
- 2500 Steiner St Unit 3
- 3110 Buchanan St
- 2218 Clay St
- 1776 Green St Unit 201
- 35 Moulton St Unit 2
- 2384 Union St
- 2539 Clay St Unit 1
- 2121 Webster St Unit GPH1
- 2190 Broadway St Unit PH
- 2190 Broadway St Unit 9W
- 2190 Broadway St Unit 4E
- 2190 Broadway St Unit 7E
- 2190 Broadway St Unit 6W
- 2190 Broadway St Unit 6E
- 2190 Broadway St Unit 5W
- 2190 Broadway St Unit 5E
- 2190 Broadway St Unit 4W
- 2190 Broadway St Unit 3W
- 2190 Broadway St Unit 3E
- 2190 Broadway St Unit 2E
- 2190 Broadway St Unit 1E
- 2190 Broadway St Unit 12W
- 2190 Broadway St Unit 11W
- 2190 Broadway St Unit 11E
- 2190 Broadway St Unit 10W
- 2190 Broadway St Unit 10E
- 2190 Broadway St Unit 9E
- 2190 Broadway St Unit 8W