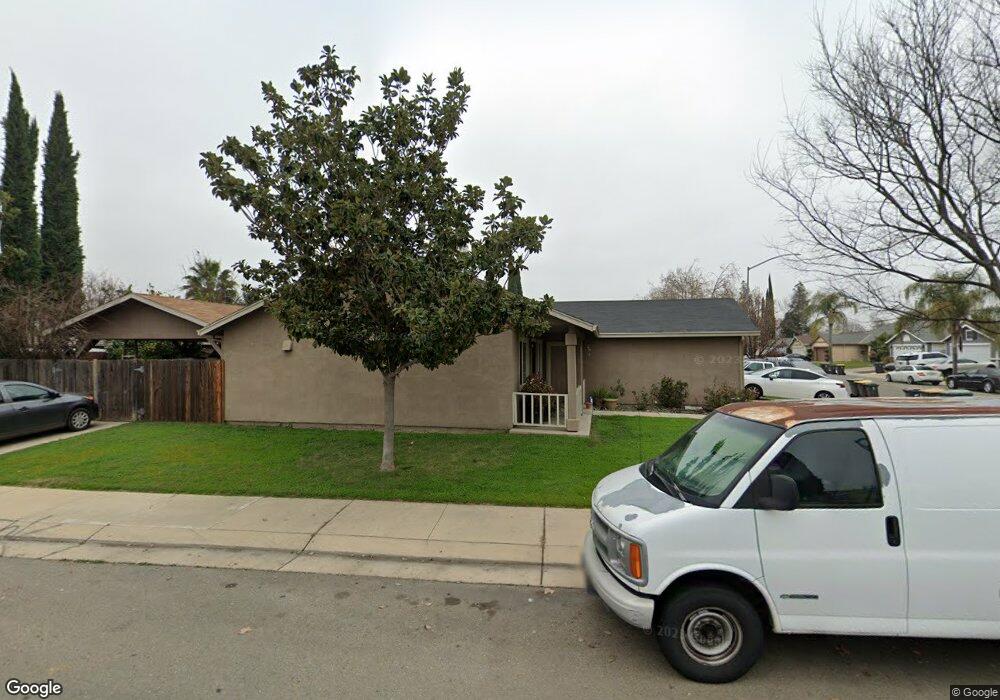
2193 Claycomb Way Stockton, CA 95206
Seaport NeighborhoodEstimated Value: $230,000 - $419,000
3
Beds
2
Baths
1,040
Sq Ft
$337/Sq Ft
Est. Value
About This Home
This home is located at 2193 Claycomb Way, Stockton, CA 95206 and is currently estimated at $350,318, approximately $336 per square foot. 2193 Claycomb Way is a home located in San Joaquin County with nearby schools including San Joaquin Elementary School, John Marshall Elementary School, and Taylor Leadership Academy.
Ownership History
Date
Name
Owned For
Owner Type
Purchase Details
Closed on
Nov 23, 2009
Sold by
Tapia Elias and Rodriguez Veronica Garcia
Bought by
Hernandez Joe
Current Estimated Value
Purchase Details
Closed on
Dec 24, 2001
Sold by
Midgley Marshall and Midgley Charlotte
Bought by
Tapia Elias and Rodriguez Veronica Garcia
Home Financials for this Owner
Home Financials are based on the most recent Mortgage that was taken out on this home.
Original Mortgage
$127,991
Interest Rate
6.51%
Mortgage Type
FHA
Purchase Details
Closed on
Apr 2, 2001
Sold by
Tri Mark San Joaquin Llc
Bought by
Dellaringa Robert
Home Financials for this Owner
Home Financials are based on the most recent Mortgage that was taken out on this home.
Original Mortgage
$64,750
Interest Rate
7.19%
Create a Home Valuation Report for This Property
The Home Valuation Report is an in-depth analysis detailing your home's value as well as a comparison with similar homes in the area
Home Values in the Area
Average Home Value in this Area
Purchase History
| Date | Buyer | Sale Price | Title Company |
|---|---|---|---|
| Hernandez Joe | $90,000 | Old Republic Title Company | |
| Tapia Elias | $130,000 | Fidelity National Title Co | |
| Dellaringa Robert | $92,500 | First American Title Co |
Source: Public Records
Mortgage History
| Date | Status | Borrower | Loan Amount |
|---|---|---|---|
| Previous Owner | Tapia Elias | $127,991 | |
| Previous Owner | Dellaringa Robert | $64,750 |
Source: Public Records
Tax History Compared to Growth
Tax History
| Year | Tax Paid | Tax Assessment Tax Assessment Total Assessment is a certain percentage of the fair market value that is determined by local assessors to be the total taxable value of land and additions on the property. | Land | Improvement |
|---|---|---|---|---|
| 2025 | $1,654 | $116,161 | $28,393 | $87,768 |
| 2024 | $1,626 | $113,885 | $27,837 | $86,048 |
| 2023 | $1,590 | $111,653 | $27,292 | $84,361 |
| 2022 | $1,421 | $109,464 | $26,757 | $82,707 |
| 2021 | $1,374 | $107,319 | $26,233 | $81,086 |
| 2020 | $1,396 | $106,220 | $25,965 | $80,255 |
| 2019 | $1,390 | $104,138 | $25,456 | $78,682 |
| 2018 | $1,939 | $102,097 | $24,957 | $77,140 |
| 2017 | $1,765 | $100,096 | $24,468 | $75,628 |
| 2016 | $1,764 | $98,134 | $23,988 | $74,146 |
| 2014 | $1,687 | $94,769 | $23,166 | $71,603 |
Source: Public Records
Map
Nearby Homes
- 1823 Fort Hall Place
- 2128 Green River Ln
- 2050 Grey Stone Dr
- 2650 S Fresno Ave
- 1409 Laguna Cir
- 1413 Laguna Cir
- 1156 Derrick Dr
- 1232 Denver Ave
- 2242 Port Trinity Cir
- 864 W 5th St
- 2215 Dune Place
- 2079 Gordon Verner Cir
- 2402 Sailboat Ct
- 2428 Shell Ct
- 3745 Wild Rose Ln
- 1661 W Hazelton Ave
- 2625 Crestmore Cir
- 1890 Gordon Verner Cir
- 309 S Los Angeles Ave
- 3330 Konig Ct
- 2179 Claycomb Way
- 2155 Claycomb Way
- 2196 Moncado Dr
- 2184 Moncado Dr
- 2020 Saint Lakes Way
- 2016 Saint Lakes Way
- 2009 Saint Lakes Way
- 2172 Moncado Dr
- 2131 Claycomb Way
- 2012 Saint Lakes Way
- 2028 Saint Lakes Way
- 2158 Moncado Dr
- 2154 Claycomb Way
- 2008 Saint Lakes Way
- 2005 Saint Lakes Way
- 2034 Saint Lakes Way
- 2107 Claycomb Way
- 2130 Claycomb Way
- 2146 Moncado Dr
- 2004 Saint Lakes Way