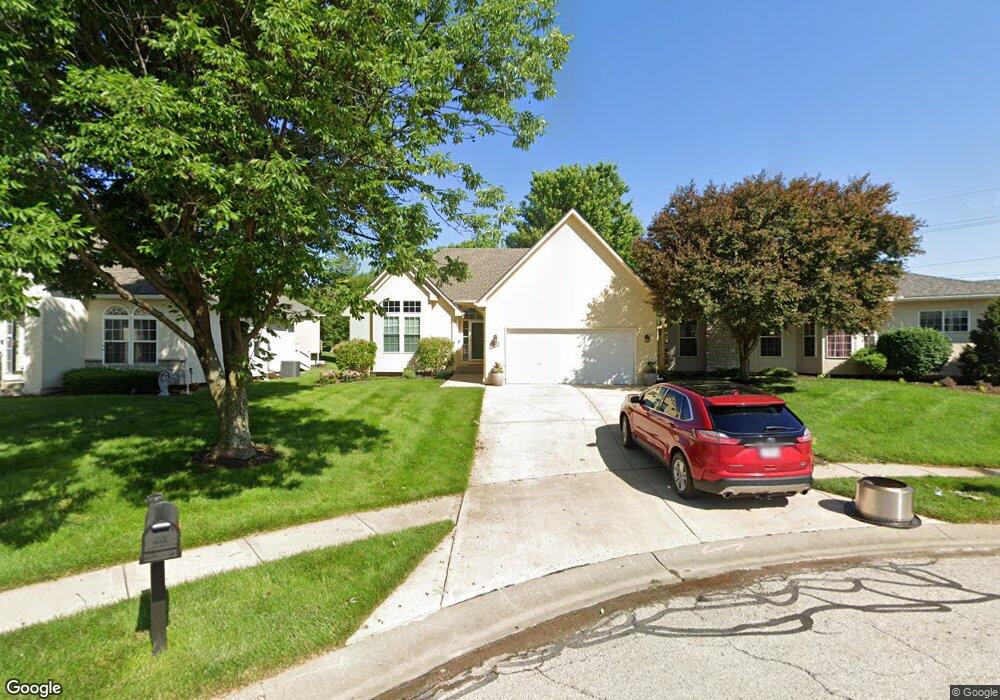
21930 W 119th Terrace Olathe, KS 66061
Estimated Value: $398,081 - $457,000
2
Beds
2
Baths
1,496
Sq Ft
$286/Sq Ft
Est. Value
About This Home
This home is located at 21930 W 119th Terrace, Olathe, KS 66061 and is currently estimated at $428,020, approximately $286 per square foot. 21930 W 119th Terrace is a home located in Johnson County with nearby schools including Millbrooke Elementary, Summit Trail Middle School, and Olathe Northwest High School.
Ownership History
Date
Name
Owned For
Owner Type
Purchase Details
Closed on
Oct 25, 2022
Sold by
Ortega Trust
Bought by
Wiemers Living Trust
Current Estimated Value
Home Financials for this Owner
Home Financials are based on the most recent Mortgage that was taken out on this home.
Original Mortgage
$316,000
Outstanding Balance
$304,414
Interest Rate
6.02%
Mortgage Type
New Conventional
Estimated Equity
$123,606
Purchase Details
Closed on
Nov 26, 2012
Sold by
Ortega Angelo A and Ortega Celeste M
Bought by
Ortega Angelo A and Ortega Celeste M
Purchase Details
Closed on
Apr 30, 2002
Sold by
American Dream Homes Inc
Bought by
Ortega Angelo A and Ortega Celeste M
Home Financials for this Owner
Home Financials are based on the most recent Mortgage that was taken out on this home.
Original Mortgage
$153,040
Interest Rate
7.11%
Create a Home Valuation Report for This Property
The Home Valuation Report is an in-depth analysis detailing your home's value as well as a comparison with similar homes in the area
Home Values in the Area
Average Home Value in this Area
Purchase History
| Date | Buyer | Sale Price | Title Company |
|---|---|---|---|
| Wiemers Living Trust | -- | Security 1St Title | |
| Ortega Angelo A | -- | None Available | |
| Ortega Angelo A | -- | Stewart Title Inc |
Source: Public Records
Mortgage History
| Date | Status | Borrower | Loan Amount |
|---|---|---|---|
| Open | Wiemers Living Trust | $316,000 | |
| Previous Owner | Ortega Angelo A | $153,040 |
Source: Public Records
Tax History Compared to Growth
Tax History
| Year | Tax Paid | Tax Assessment Tax Assessment Total Assessment is a certain percentage of the fair market value that is determined by local assessors to be the total taxable value of land and additions on the property. | Land | Improvement |
|---|---|---|---|---|
| 2024 | $5,069 | $45,011 | $8,494 | $36,517 |
| 2023 | $4,787 | $41,734 | $8,494 | $33,240 |
| 2022 | $4,174 | $35,455 | $7,388 | $28,067 |
| 2021 | $4,061 | $32,856 | $7,388 | $25,468 |
| 2020 | $3,915 | $31,395 | $7,388 | $24,007 |
| 2019 | $3,932 | $31,314 | $6,565 | $24,749 |
| 2018 | $3,665 | $29,003 | $6,565 | $22,438 |
| 2017 | $3,443 | $26,979 | $5,972 | $21,007 |
| 2016 | $3,186 | $25,622 | $4,976 | $20,646 |
| 2015 | $3,060 | $24,633 | $4,976 | $19,657 |
| 2013 | -- | $22,667 | $5,141 | $17,526 |
Source: Public Records
Map
Nearby Homes
- 21928 W 121st St
- 22049 W 121st St
- 21919 W 121st St
- 21702 W 119th Terrace Unit 1101
- The Ranch Villas Plan at Grayson Place
- 12169 S Valley Rd
- 11921 S Tallgrass Dr Unit 603
- 11921 S Tallgrass Dr Unit 602
- 11921 S Tallgrass Dr Unit 601
- 12001 S Tallgrass Dr Unit 203
- 22640 W 119th St
- 21510 W 121st St
- 21982 W 116th Terrace
- 21723 W 116th Place
- 21736 W 116th Place
- Jasper Plan at Canyon Ranch Villas
- Sierra Plan at Canyon Ranch Villas
- 11598 S Millridge St
- 21820 W 116th Terrace
- 21794 W 123rd Terrace
- 21926 W 119th Terrace
- 21934 W 119th Terrace
- 21938 W 119th Terrace
- 21922 W 119th Terrace
- 21942 W 119th Terrace
- 21918 W 119th Terrace
- 21908 W 119th Terrace
- 21906 W 119th Terrace
- 21925 119 Terrace
- 21914 W 119th Terrace
- 21925 W 119th Terrace
- 21921 W 119th Terrace
- 21946 W 119th Terrace
- 21917 W 119th Terrace
- 21929 W 119th Terrace
- 21913 W 119th Terrace
- 21950 W 119th Terrace
- 21909 W 119th Terrace
- 21954 W 119th Terrace
- 21936 W 120th St