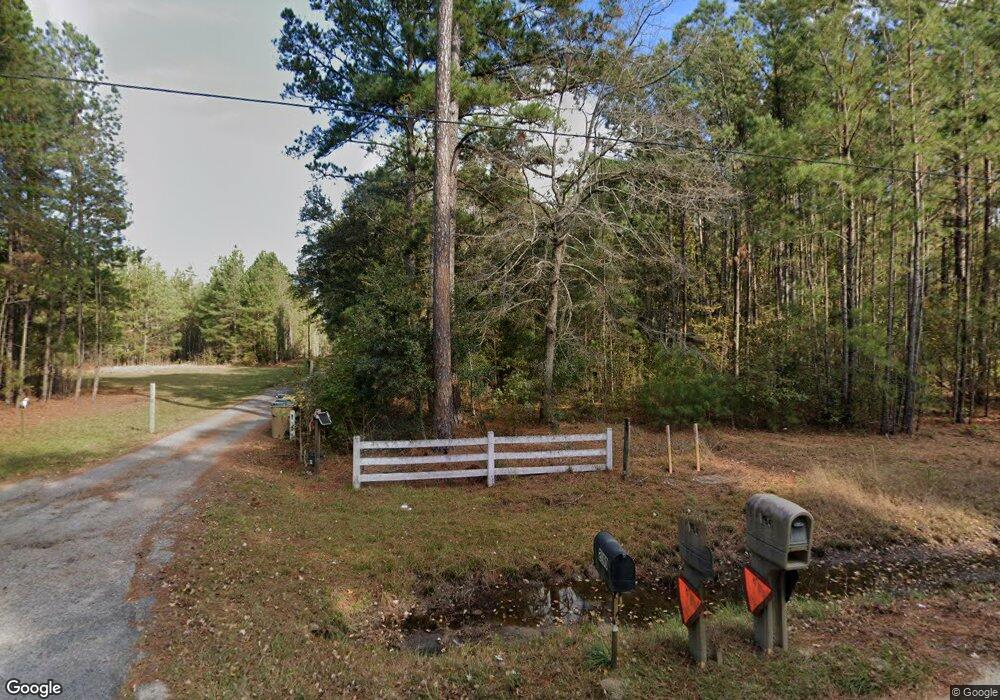
2194 Ga Highway 17 N Guyton, GA 31312
Estimated Value: $455,000 - $948,000
3
Beds
2
Baths
2,220
Sq Ft
$328/Sq Ft
Est. Value
About This Home
This home is located at 2194 Ga Highway 17 N, Guyton, GA 31312 and is currently estimated at $728,633, approximately $328 per square foot. 2194 Ga Highway 17 N is a home located in Effingham County with nearby schools including Guyton Elementary School, Effingham County Middle School, and Effingham County High School.
Ownership History
Date
Name
Owned For
Owner Type
Purchase Details
Closed on
Sep 27, 2013
Sold by
Avila Francis M
Bought by
Avila Francis M and Avila Marianne S
Current Estimated Value
Purchase Details
Closed on
Dec 28, 2012
Sold by
Pabst Steven J
Bought by
Pabst Karaann M and Pabst Steven J
Purchase Details
Closed on
Oct 23, 2012
Sold by
Holmes Stephen R
Bought by
Pabst Steven J
Home Financials for this Owner
Home Financials are based on the most recent Mortgage that was taken out on this home.
Original Mortgage
$337,500
Interest Rate
3.42%
Mortgage Type
New Conventional
Purchase Details
Closed on
Oct 6, 2005
Sold by
Dixon William T
Bought by
Holmes Stephen R and Holmes Susan A
Create a Home Valuation Report for This Property
The Home Valuation Report is an in-depth analysis detailing your home's value as well as a comparison with similar homes in the area
Home Values in the Area
Average Home Value in this Area
Purchase History
| Date | Buyer | Sale Price | Title Company |
|---|---|---|---|
| Avila Francis M | -- | -- | |
| Pabst Karaann M | -- | -- | |
| Pabst Steven J | $88,000 | -- | |
| Pabst Karaann M | -- | -- | |
| Pabst Karaann M | $375,000 | -- | |
| Holmes Stephen R | $500,000 | -- | |
| Holmes Stephen R | -- | -- | |
| Holmes Stephen R | $500,000 | -- |
Source: Public Records
Mortgage History
| Date | Status | Borrower | Loan Amount |
|---|---|---|---|
| Previous Owner | Pabst Karaann M | $337,500 | |
| Closed | Holmes Stephen R | $0 |
Source: Public Records
Tax History Compared to Growth
Tax History
| Year | Tax Paid | Tax Assessment Tax Assessment Total Assessment is a certain percentage of the fair market value that is determined by local assessors to be the total taxable value of land and additions on the property. | Land | Improvement |
|---|---|---|---|---|
| 2024 | $4,679 | $204,192 | $63,625 | $140,567 |
| 2023 | $3,159 | $153,609 | $63,625 | $89,984 |
| 2022 | $3,289 | $122,129 | $32,145 | $89,984 |
| 2021 | $3,174 | $117,149 | $30,909 | $86,240 |
| 2020 | $2,995 | $111,984 | $30,303 | $81,681 |
| 2019 | $2,974 | $111,984 | $30,303 | $81,681 |
| 2018 | $2,869 | $111,733 | $34,713 | $77,020 |
| 2017 | $2,789 | $111,733 | $34,713 | $77,020 |
| 2016 | $2,653 | $111,438 | $34,713 | $76,726 |
| 2015 | -- | $111,439 | $34,713 | $76,726 |
| 2014 | -- | $104,564 | $34,713 | $69,851 |
| 2013 | -- | $148,608 | $36,778 | $111,829 |
Source: Public Records
Map
Nearby Homes
- 112 Wakefield Dr
- 114 Wakefield Dr
- 1650 Ga Highway 17 N
- 1650 Georgia 17
- 104 Sunrise Dr
- 113 Beecher Dr
- 410 Newton Rd
- 338 Gracen Rd
- 60 Del A Rae Cir
- 0 Del - A - Rae Cir Unit 10573783
- 5 Honeysuckle Ct
- 311 Samuel Smalls Sr Ave
- 515 Samuel Smalls Sr Ave
- 106 Sumter St
- 106 Serenoa Dr
- 104 Juniper Dr
- 115 Juniper Dr
- 101 Juniper Dr
- 104 Serenoa Dr
- 2194 Ga Highway 17 N
- 2194 Ga Highway 17 N
- 2190 Ga Highway 17 N
- 2182 N Highway 17 N
- 2110 Ga Highway 17 N
- 2080 Ga Highway 17 N
- 2080 Ga Highway 17 N
- 2080 Ga Highway 17 N
- 2252 Ga Highway 17 N
- 1964 Ga Highway 17 N
- 2334 Ga Highway 17 N
- 2038 Georgia 17
- 2038 Ga Highway 17 N
- 2038 Ga Highway 17 N
- 2079 Ga Highway 17 N
- 2079 Hwy 17
- 2041 Hwy 17 N
- 2041 Ga Highway 17 N
- 2330 Ga Highway 17 N
- 1980 Ga Highway 17 N