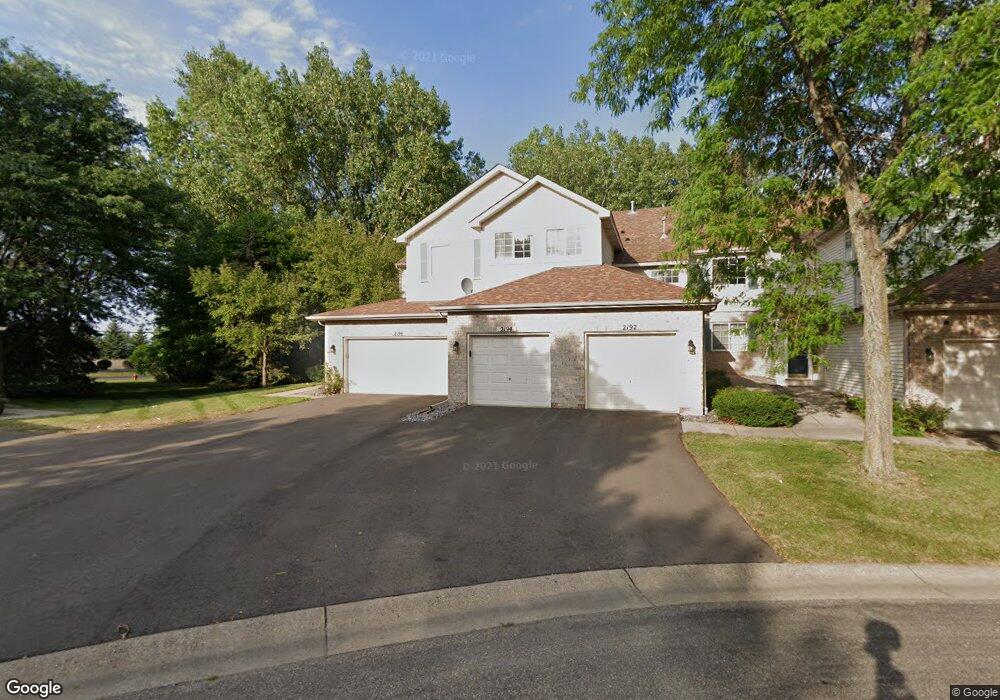
2196 Water Lilly Ln Saint Paul, MN 55122
Estimated Value: $293,000 - $355,000
2
Beds
3
Baths
1,478
Sq Ft
$211/Sq Ft
Est. Value
About This Home
This home is located at 2196 Water Lilly Ln, Saint Paul, MN 55122 and is currently estimated at $311,797, approximately $210 per square foot. 2196 Water Lilly Ln is a home located in Dakota County with nearby schools including William Byrne Elementary School, Burnsville High School, and Gateway STEM Academy.
Ownership History
Date
Name
Owned For
Owner Type
Purchase Details
Closed on
Jun 13, 2016
Sold by
Mcmullin Ian L
Bought by
Mcmullin Ian L and Ian Mcmullin Living Trust
Current Estimated Value
Home Financials for this Owner
Home Financials are based on the most recent Mortgage that was taken out on this home.
Original Mortgage
$190,000
Outstanding Balance
$151,219
Interest Rate
3.57%
Mortgage Type
New Conventional
Estimated Equity
$160,578
Purchase Details
Closed on
Sep 19, 2015
Sold by
Mcmullin Ian L
Bought by
Mcmullin Ian C and Ian Mcmullin Living Trust
Purchase Details
Closed on
Aug 18, 2006
Sold by
Nelson Micah P and Nelson Jessie G
Bought by
Mcmullin Ian L
Purchase Details
Closed on
Sep 27, 2002
Sold by
Nelson Bruce W and Nelson Linda J
Bought by
Nelson Micah P and Gillund Jessie M
Purchase Details
Closed on
Jan 31, 1997
Sold by
Town & Country Homes Inc
Bought by
Nelson Linda J and Nelson Bruce W
Create a Home Valuation Report for This Property
The Home Valuation Report is an in-depth analysis detailing your home's value as well as a comparison with similar homes in the area
Home Values in the Area
Average Home Value in this Area
Purchase History
| Date | Buyer | Sale Price | Title Company |
|---|---|---|---|
| Mcmullin Ian L | -- | Attorney | |
| Mcmullin Ian L | -- | Title Source Inc | |
| Mcmullin Ian C | -- | None Available | |
| Mcmullin Ian L | $205,500 | -- | |
| Nelson Micah P | $198,389 | -- | |
| Nelson Linda J | $143,800 | -- |
Source: Public Records
Mortgage History
| Date | Status | Borrower | Loan Amount |
|---|---|---|---|
| Open | Mcmullin Ian L | $190,000 |
Source: Public Records
Tax History Compared to Growth
Tax History
| Year | Tax Paid | Tax Assessment Tax Assessment Total Assessment is a certain percentage of the fair market value that is determined by local assessors to be the total taxable value of land and additions on the property. | Land | Improvement |
|---|---|---|---|---|
| 2024 | $2,794 | $286,500 | $30,300 | $256,200 |
| 2023 | $2,794 | $291,000 | $30,800 | $260,200 |
| 2022 | $2,976 | $280,100 | $28,000 | $252,100 |
| 2021 | $2,536 | $250,400 | $25,000 | $225,400 |
| 2020 | $2,576 | $234,800 | $23,400 | $211,400 |
| 2019 | $2,350 | $229,200 | $22,900 | $206,300 |
| 2018 | $2,235 | $202,100 | $20,200 | $181,900 |
| 2017 | $2,118 | $184,100 | $18,400 | $165,700 |
| 2016 | $1,942 | $172,300 | $17,200 | $155,100 |
| 2015 | $1,825 | $146,970 | $14,697 | $132,273 |
| 2014 | -- | $142,719 | $14,263 | $128,456 |
| 2013 | -- | $126,805 | $12,638 | $114,167 |
Source: Public Records
Map
Nearby Homes
- 2177 Cool Stream Cir
- 2208 Liberty Ln
- 4165 Old Sibley Hwy
- 3113 Chandler Ct
- 10917 Southview Dr
- 4035 River Valley Way
- 2079 Garnet Ln
- 2074 Carnelian Ln
- 11017 27th Ave S
- 11036 27th Ave S
- 11459 Galtier Dr
- 4413 Slater Rd
- 4429 Slater Rd
- 2008 Zircon Ln
- 11121 Carver Ct
- 2404 Hayes Ct
- 4110 Rahn Rd Unit 215
- 4110 Rahn Rd Unit 312
- 4130 Rahn Rd Unit B111
- 4130 Rahn Rd Unit 209
- 2194 Water Lilly Ln Unit 802
- 2192 Water Lilly Ln
- 2192 Water Lilly Ln
- 2190 Water Lilly Ln
- 2190 Water Lilly Ln
- 2198 Water Lilly Ln Unit 708
- 2186 Water Lilly Ln Unit 806
- 2186 Water Lilly Ln
- 2186 Water Lilly Ln
- 2200 Water Lilly Ln Unit 707
- 2202 Water Lilly Ln Unit 706
- 2204 Water Lilly Ln
- 2206 Water Lilly Ln Unit 704
- 2208 Water Lilly Ln Unit 703
- 2180 Water Lilly Ln
- 2210 Water Lilly Ln Unit 702
- 2178 Water Lilly Ln Unit 902
- 2178 Water Lilly Ln
- 2212 Water Lilly Ln
- 2212 Water Lilly Ln Unit 701