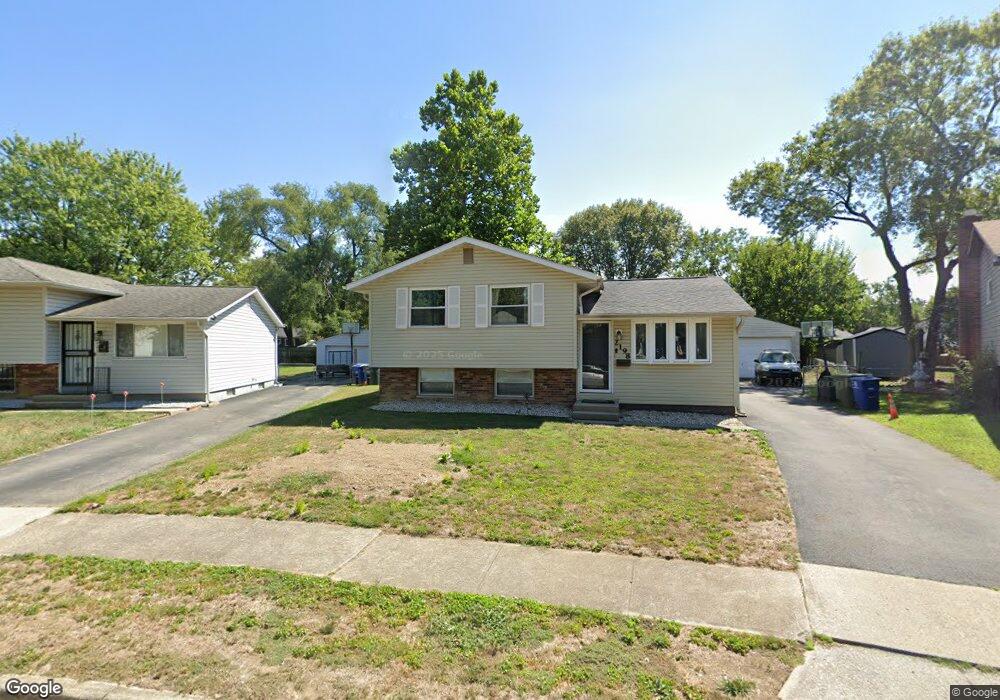
2198 Balford Square E Columbus, OH 43232
Glenbrook NeighborhoodEstimated Value: $184,000 - $229,000
3
Beds
2
Baths
1,444
Sq Ft
$145/Sq Ft
Est. Value
About This Home
This home is located at 2198 Balford Square E, Columbus, OH 43232 and is currently estimated at $209,771, approximately $145 per square foot. 2198 Balford Square E is a home located in Franklin County with nearby schools including Easthaven Elementary School, Yorktown Middle School, and Independence High School.
Ownership History
Date
Name
Owned For
Owner Type
Purchase Details
Closed on
Jun 15, 2001
Sold by
Brandon Janet L
Bought by
Coleman Vincent M and Coleman Angela N
Current Estimated Value
Home Financials for this Owner
Home Financials are based on the most recent Mortgage that was taken out on this home.
Original Mortgage
$90,270
Outstanding Balance
$33,070
Interest Rate
7.27%
Mortgage Type
VA
Estimated Equity
$176,701
Purchase Details
Closed on
Dec 6, 1999
Sold by
Brandon Mark W
Bought by
Brandon Janet L
Purchase Details
Closed on
Aug 8, 1997
Sold by
Harrell Wayman F
Bought by
Brandon Mark W and Brandon Janet L
Home Financials for this Owner
Home Financials are based on the most recent Mortgage that was taken out on this home.
Original Mortgage
$74,900
Interest Rate
7.68%
Mortgage Type
VA
Purchase Details
Closed on
Jun 11, 1991
Purchase Details
Closed on
Jan 17, 1990
Create a Home Valuation Report for This Property
The Home Valuation Report is an in-depth analysis detailing your home's value as well as a comparison with similar homes in the area
Home Values in the Area
Average Home Value in this Area
Purchase History
| Date | Buyer | Sale Price | Title Company |
|---|---|---|---|
| Coleman Vincent M | $88,500 | Chicago Title | |
| Brandon Janet L | -- | -- | |
| Brandon Mark W | $72,900 | Midland Title Security Inc | |
| -- | $54,000 | -- | |
| -- | -- | -- |
Source: Public Records
Mortgage History
| Date | Status | Borrower | Loan Amount |
|---|---|---|---|
| Open | Coleman Vincent M | $90,270 | |
| Closed | Brandon Mark W | $74,900 |
Source: Public Records
Tax History
| Year | Tax Paid | Tax Assessment Tax Assessment Total Assessment is a certain percentage of the fair market value that is determined by local assessors to be the total taxable value of land and additions on the property. | Land | Improvement |
|---|---|---|---|---|
| 2025 | $2,792 | $62,200 | $20,300 | $41,900 |
| 2024 | $2,792 | $62,200 | $20,300 | $41,900 |
| 2023 | $2,756 | $62,195 | $20,300 | $41,895 |
| 2022 | $1,748 | $33,710 | $9,070 | $24,640 |
| 2021 | $1,751 | $33,710 | $9,070 | $24,640 |
| 2020 | $1,754 | $33,710 | $9,070 | $24,640 |
| 2019 | $1,616 | $26,640 | $7,250 | $19,390 |
| 2018 | $1,175 | $26,640 | $7,250 | $19,390 |
| 2017 | $1,615 | $26,640 | $7,250 | $19,390 |
| 2016 | $812 | $12,260 | $5,990 | $6,270 |
| 2015 | $737 | $12,260 | $5,990 | $6,270 |
| 2014 | $739 | $12,260 | $5,990 | $6,270 |
| 2013 | $895 | $30,100 | $6,300 | $23,800 |
Source: Public Records
Map
Nearby Homes
- 2251 Meridian Ct
- 2275 Cardston Ct
- 0 Rotunda Dr Unit 271
- 2278 Wadsworth Dr Unit D
- 3038 Wadsworth Ct
- 3036 Wadsworth Ct
- 2942 Arrowhead Ct
- 3830 Charbonnett Ct Unit 6-A
- 1836 Penfield Ct S
- 3325 E Deshler Ave
- 3428 LIV Moor Dr
- 1679 Penfield Rd
- 3064 Niagara Ct E
- 3285 Scottwood Rd
- 1637 S James Rd
- 2840 Manola Dr
- 2825 S Hampton Rd
- 1619 Basil Dr
- 1677 Kenview Rd
- 3669 Mathena Way
- 2194 Balford Square E
- 3337 Balford Square S
- 2188 Balford Square E
- 3331 Balford Square S
- 2182 Balford Square E
- 3323 Balford Square S
- 2183 Balford Square E
- 3338 Meridian Rd
- 3344 Meridian Rd
- 2205 New Village Rd
- 2213 New Village Rd
- 3330 Meridian Rd
- 2199 New Village Rd
- 2176 Balford Square E
- 3350 Meridian Rd
- 2221 New Village Rd
- 2175 Balford Square E
- 3317 Balford Square S
- 2193 New Village Rd
Your Personal Tour Guide
Ask me questions while you tour the home.