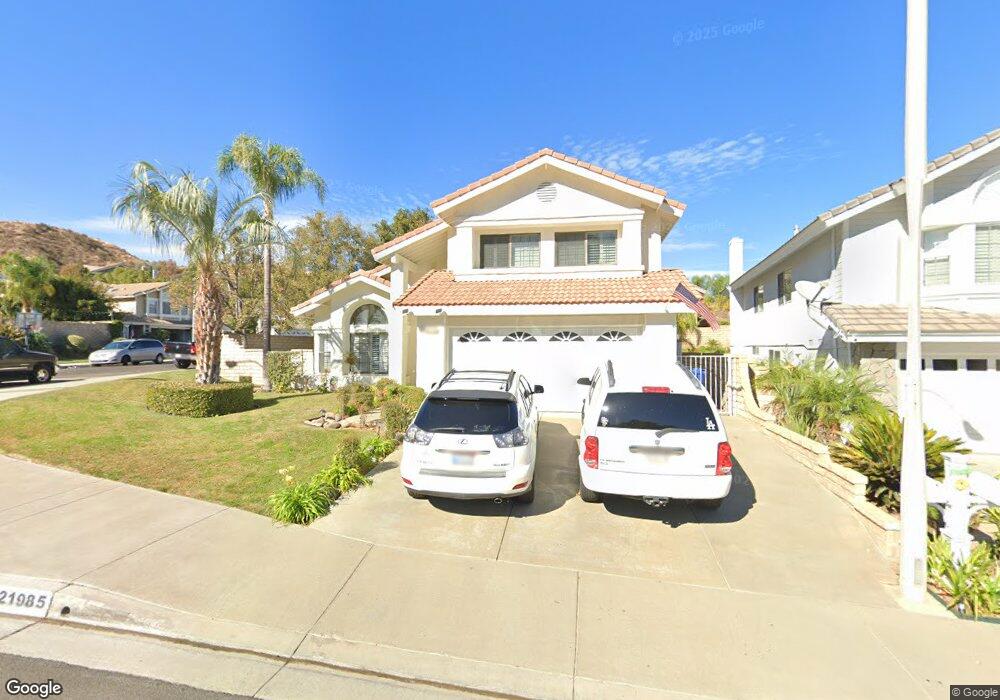
21985 Jeffers Ln Santa Clarita, CA 91350
Saugus NeighborhoodEstimated Value: $808,662 - $940,000
3
Beds
3
Baths
1,845
Sq Ft
$474/Sq Ft
Est. Value
About This Home
This home is located at 21985 Jeffers Ln, Santa Clarita, CA 91350 and is currently estimated at $873,916, approximately $473 per square foot. 21985 Jeffers Ln is a home located in Los Angeles County with nearby schools including Rosedell Elementary School, Arroyo Seco Junior High School, and Saugus High School.
Ownership History
Date
Name
Owned For
Owner Type
Purchase Details
Closed on
Jun 10, 2020
Sold by
Ludwick Marc and Hollyfield Karen
Bought by
Ludwick Marc E and Hollyfield Karen S
Current Estimated Value
Purchase Details
Closed on
Feb 13, 2003
Sold by
Ludwick Marc and Hollyfield Karen
Bought by
Ludwick Marc and Hollyfield Karen
Purchase Details
Closed on
Sep 7, 1998
Sold by
Kutcher Matt and Kutcher Mendy
Bought by
Ludwick Marc E and Hollyfield Karen S
Home Financials for this Owner
Home Financials are based on the most recent Mortgage that was taken out on this home.
Original Mortgage
$180,000
Outstanding Balance
$38,417
Interest Rate
6.89%
Estimated Equity
$835,499
Purchase Details
Closed on
Aug 5, 1997
Sold by
Clark William T and Clark Karen M
Bought by
Kutcher Matt and Kutcher Mendy
Home Financials for this Owner
Home Financials are based on the most recent Mortgage that was taken out on this home.
Original Mortgage
$186,800
Interest Rate
9.12%
Create a Home Valuation Report for This Property
The Home Valuation Report is an in-depth analysis detailing your home's value as well as a comparison with similar homes in the area
Home Values in the Area
Average Home Value in this Area
Purchase History
| Date | Buyer | Sale Price | Title Company |
|---|---|---|---|
| Ludwick Marc E | -- | None Available | |
| Ludwick Marc | -- | -- | |
| Ludwick Marc E | $240,000 | Investors Title Company | |
| Kutcher Matt | $233,500 | Investors Title Company |
Source: Public Records
Mortgage History
| Date | Status | Borrower | Loan Amount |
|---|---|---|---|
| Open | Ludwick Marc E | $180,000 | |
| Previous Owner | Kutcher Matt | $186,800 |
Source: Public Records
Tax History Compared to Growth
Tax History
| Year | Tax Paid | Tax Assessment Tax Assessment Total Assessment is a certain percentage of the fair market value that is determined by local assessors to be the total taxable value of land and additions on the property. | Land | Improvement |
|---|---|---|---|---|
| 2025 | $5,335 | $376,228 | $129,482 | $246,746 |
| 2024 | $5,335 | $368,852 | $126,944 | $241,908 |
| 2023 | $5,180 | $361,620 | $124,455 | $237,165 |
| 2022 | $5,200 | $354,530 | $122,015 | $232,515 |
| 2021 | $5,109 | $347,579 | $119,623 | $227,956 |
| 2019 | $4,928 | $337,272 | $116,076 | $221,196 |
| 2018 | $4,813 | $330,659 | $113,800 | $216,859 |
| 2016 | $4,537 | $317,821 | $109,382 | $208,439 |
| 2015 | $4,369 | $313,048 | $107,739 | $205,309 |
| 2014 | $4,306 | $306,917 | $105,629 | $201,288 |
Source: Public Records
Map
Nearby Homes
- 21965 Jeffers Ln
- 22024 Jeffers Ln
- 21741 Jeffers Ln
- 22045 Milestone St
- 28051 Devon Ln
- 27929 Dexter Dr
- 27706 Kristin Ln
- 28050 Devon Ln
- 21602 Bedford Way
- 28410 Agajanian Dr
- 27632 Kevin Place
- 28123 Bobwhite Cir Unit 104
- 27768 Crookshank Dr
- 27610 Kevin Place
- 28412 Rock Canyon Dr
- 27619 Ron Ridge Dr
- 28303 Sycamore Dr
- 21643 Masterson Ct
- 21929 Peppercorn Dr
- 21558 Oak Dr Unit 78
- 21983 Jeffers Ln
- 28012 Beau Ct
- 21979 Jeffers Ln
- 22003 Jeffers Ln
- 21982 Jeffers Ln
- 21973 Jeffers Ln
- 28016 Beau Ct
- 28011 Beau Ct
- 21978 Jeffers Ln
- 22011 Jeffers Ln
- 22020 Rodeffer Place
- 22014 Rodeffer Place
- 21986 Jeffers Ln
- 28015 Beau Ct
- 22026 Rodeffer Place
- 22010 Rodeffer Place
- 22002 Jeffers Ln
- 21972 Jeffers Ln
- 21972 Jeffers Ln
- 22021 Jeffers Ln