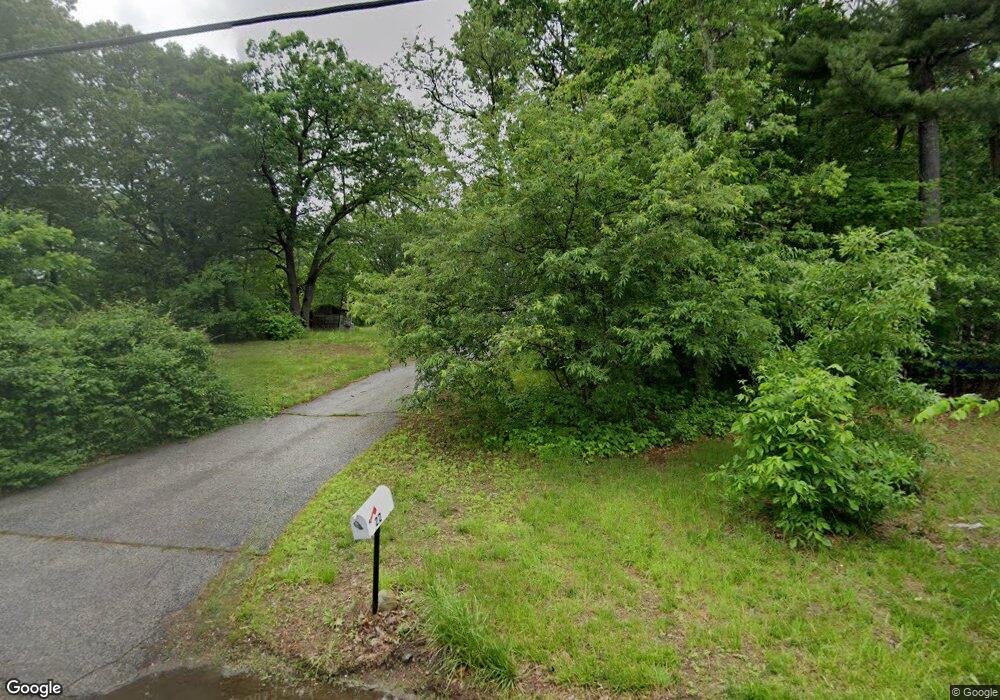
22 Ash St Londonderry, NH 03053
Estimated Value: $500,057 - $552,000
3
Beds
1
Bath
1,974
Sq Ft
$264/Sq Ft
Est. Value
About This Home
This home is located at 22 Ash St, Londonderry, NH 03053 and is currently estimated at $521,514, approximately $264 per square foot. 22 Ash St is a home located in Rockingham County with nearby schools including Matthew Thornton Elementary School, Londonderry Middle School, and Londonderry Senior High School.
Ownership History
Date
Name
Owned For
Owner Type
Purchase Details
Closed on
Oct 18, 2010
Sold by
Cooper John R and Cooper Edward C
Bought by
Pillsbury Realty Dev
Current Estimated Value
Purchase Details
Closed on
Jul 2, 2009
Sold by
Lampro Howard R and Lampro Doris A
Bought by
Cooper Edward
Home Financials for this Owner
Home Financials are based on the most recent Mortgage that was taken out on this home.
Original Mortgage
$182,800
Interest Rate
4.86%
Create a Home Valuation Report for This Property
The Home Valuation Report is an in-depth analysis detailing your home's value as well as a comparison with similar homes in the area
Home Values in the Area
Average Home Value in this Area
Purchase History
| Date | Buyer | Sale Price | Title Company |
|---|---|---|---|
| Pillsbury Realty Dev | $300,000 | -- | |
| Cooper Edward | $228,500 | -- |
Source: Public Records
Mortgage History
| Date | Status | Borrower | Loan Amount |
|---|---|---|---|
| Previous Owner | Cooper Edward | $182,800 | |
| Previous Owner | Cooper Edward | $152,000 |
Source: Public Records
Tax History Compared to Growth
Tax History
| Year | Tax Paid | Tax Assessment Tax Assessment Total Assessment is a certain percentage of the fair market value that is determined by local assessors to be the total taxable value of land and additions on the property. | Land | Improvement |
|---|---|---|---|---|
| 2024 | $6,724 | $416,600 | $177,200 | $239,400 |
| 2023 | $6,520 | $416,600 | $177,200 | $239,400 |
| 2022 | $6,331 | $342,600 | $133,700 | $208,900 |
| 2021 | $6,297 | $342,600 | $133,700 | $208,900 |
| 2020 | $6,105 | $303,600 | $109,200 | $194,400 |
| 2019 | $5,887 | $303,600 | $109,200 | $194,400 |
| 2018 | $4,851 | $222,500 | $91,400 | $131,100 |
| 2017 | $4,808 | $222,500 | $91,400 | $131,100 |
| 2016 | $4,784 | $222,500 | $91,400 | $131,100 |
| 2015 | $4,677 | $222,500 | $91,400 | $131,100 |
| 2014 | $4,693 | $222,500 | $91,400 | $131,100 |
| 2011 | -- | $227,300 | $91,400 | $135,900 |
Source: Public Records
Map
Nearby Homes
- 29 Beacon St
- 17 1/2 Beacon St
- 24 Jefferson St
- 38 High St
- 71 N High St Unit 10
- 50 Franklin St
- 36 Stonegate Ln
- 29 Fordway St
- 6 Howard St
- 9 Stonegate Ln
- 2 B Gale Dr
- 3 Nutfield Ct Unit 2
- 23 Oak St
- 10 Abbott St
- 3.5 Mt Pleasant St
- 18 Mount Pleasant St
- 27 Mount Pleasant St Unit R
- 27 Mount Pleasant St Unit L
- 84 E Broadway
- 65 Fordway Extension Unit 4310