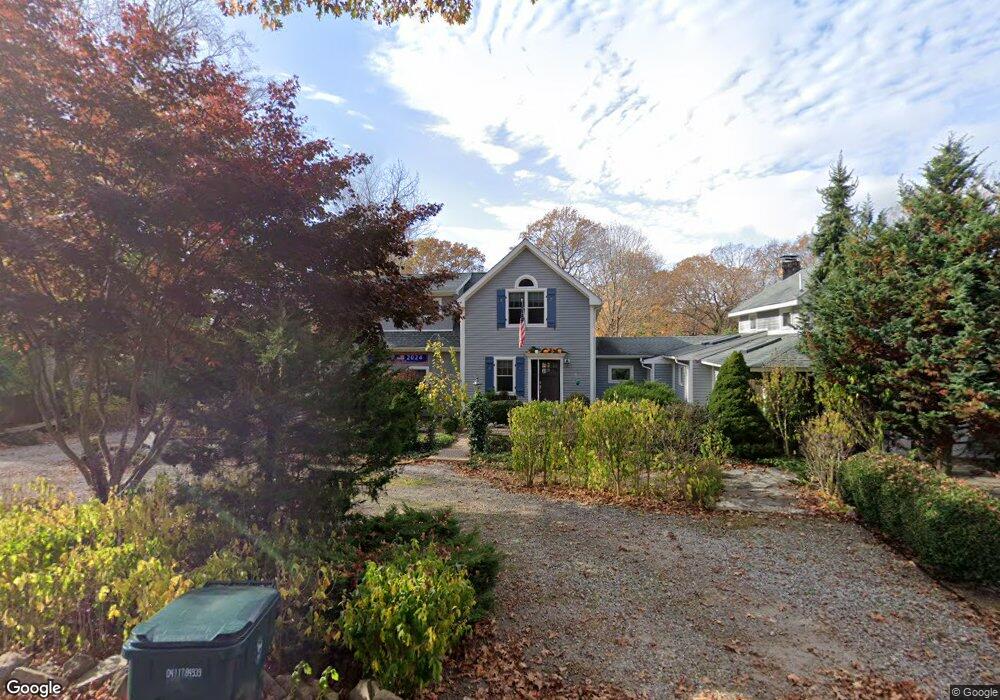
22 Buttonball Rd Old Lyme, CT 06371
Estimated Value: $560,000 - $994,000
3
Beds
3
Baths
3,315
Sq Ft
$244/Sq Ft
Est. Value
About This Home
This home is located at 22 Buttonball Rd, Old Lyme, CT 06371 and is currently estimated at $809,357, approximately $244 per square foot. 22 Buttonball Rd is a home located in New London County with nearby schools including Mile Creek School, Lyme-Old Lyme Middle School, and Lyme-Old Lyme High School.
Ownership History
Date
Name
Owned For
Owner Type
Purchase Details
Closed on
Mar 10, 2016
Sold by
Traver-Steiner Richard
Bought by
Traver-Steiner Richard and Steiner Christina M
Current Estimated Value
Purchase Details
Closed on
May 2, 2005
Sold by
Duthie Jon and Duthie Donna
Bought by
Steiner Richard Traver
Home Financials for this Owner
Home Financials are based on the most recent Mortgage that was taken out on this home.
Original Mortgage
$164,000
Interest Rate
5.95%
Purchase Details
Closed on
Aug 31, 1995
Sold by
Frost Susan B and Renn Daniel F
Bought by
Duthie Jon C and Duthie Donna M
Purchase Details
Closed on
Nov 19, 1987
Sold by
Goodrich Dale E
Bought by
Frost Susan B
Create a Home Valuation Report for This Property
The Home Valuation Report is an in-depth analysis detailing your home's value as well as a comparison with similar homes in the area
Home Values in the Area
Average Home Value in this Area
Purchase History
| Date | Buyer | Sale Price | Title Company |
|---|---|---|---|
| Traver-Steiner Richard | -- | -- | |
| Steiner Richard Traver | $205,000 | -- | |
| Duthie Jon C | $110,000 | -- | |
| Frost Susan B | $127,000 | -- |
Source: Public Records
Mortgage History
| Date | Status | Borrower | Loan Amount |
|---|---|---|---|
| Open | Frost Susan B | $50,000 | |
| Previous Owner | Frost Susan B | $180,000 | |
| Previous Owner | Frost Susan B | $164,000 |
Source: Public Records
Tax History
| Year | Tax Paid | Tax Assessment Tax Assessment Total Assessment is a certain percentage of the fair market value that is determined by local assessors to be the total taxable value of land and additions on the property. | Land | Improvement |
|---|---|---|---|---|
| 2025 | $7,626 | $469,900 | $134,200 | $335,700 |
| 2024 | $6,995 | $286,700 | $92,300 | $194,400 |
| 2023 | $6,737 | $286,700 | $92,300 | $194,400 |
| 2022 | $6,737 | $286,700 | $92,300 | $194,400 |
| 2021 | $6,680 | $286,700 | $92,300 | $194,400 |
| 2020 | $6,651 | $286,700 | $92,300 | $194,400 |
| 2019 | $6,299 | $281,100 | $97,100 | $184,000 |
| 2018 | $5,591 | $255,200 | $97,100 | $158,100 |
| 2017 | $3,898 | $179,200 | $97,100 | $82,100 |
| 2016 | $3,799 | $179,200 | $97,100 | $82,100 |
| 2015 | $3,695 | $179,200 | $97,100 | $82,100 |
| 2014 | $3,706 | $188,500 | $97,100 | $91,400 |
Source: Public Records
Map
Nearby Homes
- 11 Buttonball Rd Unit "The Ashton"
- 12 Littlefield Dr
- 184 Shore Rd
- 224 Shore Rd
- 7 Katherine Rd
- 44 Hartford Ave
- 6-1 and 8-1 Meetinghouse Ln
- 59 Saltaire Dr
- 243 Mile Creek Rd
- 13 Victoria Ln
- 14 Cutler Rd
- 2 Berberis Dr
- 3 Ferry Rd
- 34 Lyme St
- 60 Lyme St
- 1 & 3 Neck Rd
- 41 Whippoorwill Rd
- 21 Fenwick St
- 5 Wyckford Ln Unit 5
- 10 Mulberry St
- 24 Buttonball Rd
- 26 Buttonball Rd
- 20 Buttonball Rd
- 18 Buttonball Rd
- 28 Buttonball Rd
- 30 Buttonball Rd
- 16-1 Buttonball Rd
- 16 Buttonball Rd
- 16 Buttonball Rd
- 11 Cameron Ct Unit "The Ashton"
- 32 Buttonball Rd
- 11 Buttonball Rd
- 12 Buttonball Rd
- 21 Buttonball Rd
- 2 Buttonball Rd
- 31 Buttonball Rd
- 33 Buttonball Rd
- 27 Buttonball Rd
- 61 Buttonball Rd
- 6 Old Shore Rd
Your Personal Tour Guide
Ask me questions while you tour the home.