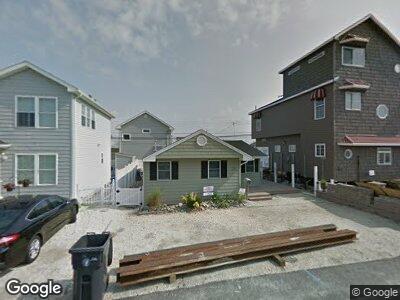
22 Colony Rd Seaside Heights, NJ 08751
Estimated Value: $672,500 - $955,000
3
Beds
2
Baths
796
Sq Ft
$1,048/Sq Ft
Est. Value
About This Home
This home is located at 22 Colony Rd, Seaside Heights, NJ 08751 and is currently estimated at $833,875, approximately $1,047 per square foot. 22 Colony Rd is a home located in Ocean County.
Ownership History
Date
Name
Owned For
Owner Type
Purchase Details
Closed on
Aug 8, 2011
Sold by
Dyan Associates Iii L L C
Bought by
Dolese Dyan
Current Estimated Value
Home Financials for this Owner
Home Financials are based on the most recent Mortgage that was taken out on this home.
Original Mortgage
$294,000
Interest Rate
4.52%
Mortgage Type
New Conventional
Purchase Details
Closed on
Aug 28, 2007
Sold by
Dolese Dyan and Mindo Joseph
Bought by
Dyan Associates Iii Llc
Purchase Details
Closed on
Jun 25, 2004
Sold by
Maurer David J and Maurer Barbara Ann
Bought by
Dolese Dyan and Mindo Joseph
Home Financials for this Owner
Home Financials are based on the most recent Mortgage that was taken out on this home.
Original Mortgage
$440,000
Interest Rate
4.12%
Mortgage Type
Stand Alone First
Purchase Details
Closed on
May 19, 1995
Sold by
Darling Michael
Bought by
Maurer David and Maurer Barbara Ann
Home Financials for this Owner
Home Financials are based on the most recent Mortgage that was taken out on this home.
Original Mortgage
$60,000
Interest Rate
8.24%
Create a Home Valuation Report for This Property
The Home Valuation Report is an in-depth analysis detailing your home's value as well as a comparison with similar homes in the area
Home Values in the Area
Average Home Value in this Area
Purchase History
| Date | Buyer | Sale Price | Title Company |
|---|---|---|---|
| Dolese Dyan | -- | None Available | |
| Dyan Associates Iii Llc | $95,916 | None Available | |
| Dolese Dyan | $550,000 | None Available | |
| Maurer David | $113,500 | -- |
Source: Public Records
Mortgage History
| Date | Status | Borrower | Loan Amount |
|---|---|---|---|
| Open | Dolese Dyan | $375,900 | |
| Closed | Dolese Dyan | $369,500 | |
| Closed | Dolese Dyan | $294,000 | |
| Previous Owner | Dolese Dyan | $440,000 | |
| Previous Owner | Maurer David | $60,000 |
Source: Public Records
Tax History Compared to Growth
Tax History
| Year | Tax Paid | Tax Assessment Tax Assessment Total Assessment is a certain percentage of the fair market value that is determined by local assessors to be the total taxable value of land and additions on the property. | Land | Improvement |
|---|---|---|---|---|
| 2024 | $9,166 | $529,500 | $413,000 | $116,500 |
| 2023 | $8,837 | $529,500 | $413,000 | $116,500 |
| 2022 | $8,837 | $529,500 | $413,000 | $116,500 |
| 2021 | $8,136 | $324,800 | $243,600 | $81,200 |
| 2020 | $8,101 | $324,800 | $243,600 | $81,200 |
| 2019 | $7,750 | $324,800 | $243,600 | $81,200 |
| 2018 | $7,646 | $324,800 | $243,600 | $81,200 |
| 2017 | $7,581 | $324,800 | $243,600 | $81,200 |
| 2016 | $7,383 | $324,800 | $243,600 | $81,200 |
| 2015 | $7,103 | $249,500 | $243,600 | $5,900 |
| 2014 | $5,195 | $249,500 | $243,600 | $5,900 |
Source: Public Records
Map
Nearby Homes
- 3 Holiday Rd
- 1679 Route 35 N Unit 7
- 1681 Route 35 N Unit 16
- 59 Hiering Ave
- 57 Hiering Ave
- 61 Hiering Ave
- 1709 New Jersey 35 Unit 12
- 1709 New Jersey 35 Unit 14
- 51 Hiering Ave Unit A 7
- 1709 Route 35 N Unit 14
- 1722 Route 35 N Unit 1
- 57 Sampson Ave
- 39 Sampson Ave Unit 6
- 1501 Ocean Terrace Unit A
- 1501 Ocean Terrace
- 209 Dewey Dr
- 205 Dewey Dr
- 200 Sampson Ave
- 35 Carteret Ave Unit C4
- 1800 Route 35 N Unit 2