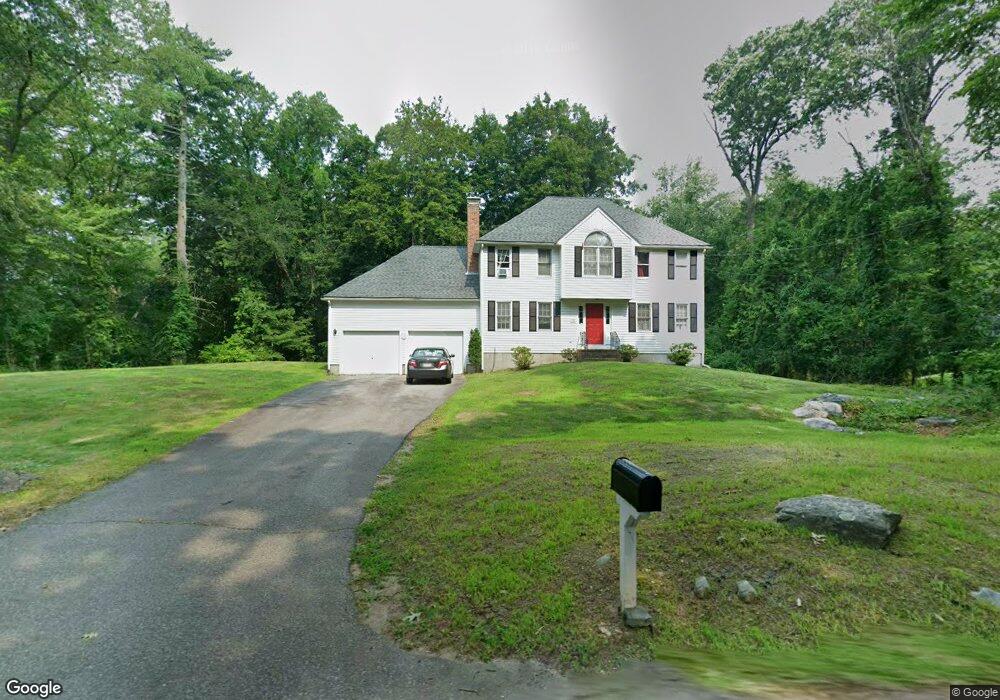
22 Cross St Norton, MA 02766
Estimated Value: $671,000 - $888,000
3
Beds
3
Baths
1,930
Sq Ft
$385/Sq Ft
Est. Value
About This Home
This home is located at 22 Cross St, Norton, MA 02766 and is currently estimated at $743,126, approximately $385 per square foot. 22 Cross St is a home located in Bristol County with nearby schools including J.C. Solmonese Elementary School, Henri A. Yelle Elementary School, and Norton Middle School.
Ownership History
Date
Name
Owned For
Owner Type
Purchase Details
Closed on
Oct 30, 2000
Sold by
Kinsley William J and Kinsley Kimberly A
Bought by
Smith Richard W and Smith Dona M
Current Estimated Value
Home Financials for this Owner
Home Financials are based on the most recent Mortgage that was taken out on this home.
Original Mortgage
$223,920
Interest Rate
7.83%
Mortgage Type
Purchase Money Mortgage
Purchase Details
Closed on
Aug 25, 1999
Sold by
Kelley Todd P and Kelley Rebecca L
Bought by
Kinsley Kimberly A and Kinsley William J
Purchase Details
Closed on
Feb 27, 1996
Sold by
P&A Construction Inc
Bought by
Gratchev Igor and Gratchev Erin E
Purchase Details
Closed on
Feb 9, 1996
Sold by
P & A Construction Inc
Bought by
Kelley Todd P and Kelley Rebecca L
Purchase Details
Closed on
Dec 16, 1993
Sold by
P&A Construction Inc
Bought by
Leung Daniel J and Leung Kathrynlee P
Create a Home Valuation Report for This Property
The Home Valuation Report is an in-depth analysis detailing your home's value as well as a comparison with similar homes in the area
Home Values in the Area
Average Home Value in this Area
Purchase History
| Date | Buyer | Sale Price | Title Company |
|---|---|---|---|
| Smith Richard W | $279,900 | -- | |
| Kinsley Kimberly A | $260,900 | -- | |
| Gratchev Igor | $132,000 | -- | |
| Kelley Todd P | $193,000 | -- | |
| Leung Daniel J | $174,640 | -- |
Source: Public Records
Mortgage History
| Date | Status | Borrower | Loan Amount |
|---|---|---|---|
| Open | Leung Daniel J | $222,000 | |
| Closed | Leung Daniel J | $223,920 | |
| Previous Owner | Leung Daniel J | $32,000 |
Source: Public Records
Tax History Compared to Growth
Tax History
| Year | Tax Paid | Tax Assessment Tax Assessment Total Assessment is a certain percentage of the fair market value that is determined by local assessors to be the total taxable value of land and additions on the property. | Land | Improvement |
|---|---|---|---|---|
| 2025 | $74 | $573,700 | $187,700 | $386,000 |
| 2024 | $6,812 | $526,000 | $178,800 | $347,200 |
| 2023 | $6,448 | $496,400 | $168,600 | $327,800 |
| 2022 | $6,280 | $440,400 | $153,300 | $287,100 |
| 2021 | $5,947 | $398,300 | $146,000 | $252,300 |
| 2020 | $5,725 | $386,800 | $141,700 | $245,100 |
| 2019 | $5,768 | $387,100 | $150,000 | $237,100 |
| 2018 | $5,680 | $374,700 | $150,000 | $224,700 |
| 2017 | $5,544 | $360,700 | $150,000 | $210,700 |
| 2016 | $5,378 | $344,500 | $150,000 | $194,500 |
| 2015 | $5,220 | $339,200 | $147,000 | $192,200 |
| 2014 | $5,004 | $325,600 | $140,000 | $185,600 |
Source: Public Records
Map
Nearby Homes
- 23 Indian Rd
- 8 Johnson Dr
- 10 Ridge Rd
- 12 Kayak Trail
- 34R Pine St
- 93 Mansfield Ave
- 15 Patten Rd
- 0 Brook Pkwy
- 0 S Washington St Unit 73437419
- 268 Reservoir St
- 39 Evergreen Rd
- 12 Sylvan Rd
- 15 S Washington St
- 3 Lloyd Cir Unit 43
- 20 Lloyd Cir Unit 32
- 18 Lloyd Cir Unit 31
- 14 Lloyd Cir Unit 29
- 38 S Washington St
- 21 Juniper Rd
- 195 E Main St