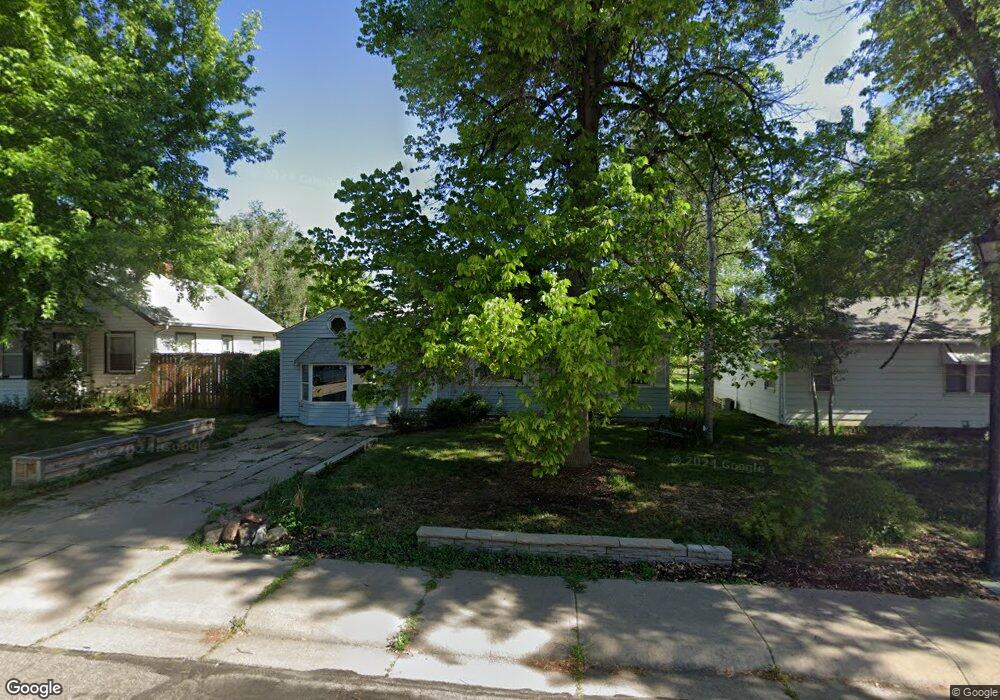
22 E 4th Ave Longmont, CO 80504
Kensington NeighborhoodEstimated Value: $356,214 - $381,000
2
Beds
1
Bath
768
Sq Ft
$482/Sq Ft
Est. Value
About This Home
This home is located at 22 E 4th Ave, Longmont, CO 80504 and is currently estimated at $369,804, approximately $481 per square foot. 22 E 4th Ave is a home located in Boulder County with nearby schools including Columbine Elementary School, Trail Ridge Middle School, and Skyline High School.
Ownership History
Date
Name
Owned For
Owner Type
Purchase Details
Closed on
Nov 30, 2005
Sold by
Allen Todd Christian and Watkins Ashley
Bought by
Allen Todd C
Current Estimated Value
Home Financials for this Owner
Home Financials are based on the most recent Mortgage that was taken out on this home.
Original Mortgage
$130,400
Outstanding Balance
$72,221
Interest Rate
6.12%
Mortgage Type
New Conventional
Estimated Equity
$297,583
Purchase Details
Closed on
Sep 20, 1999
Sold by
Mccallum Susan
Bought by
Allen Todd Christian
Home Financials for this Owner
Home Financials are based on the most recent Mortgage that was taken out on this home.
Original Mortgage
$112,100
Interest Rate
8.02%
Purchase Details
Closed on
Feb 5, 1996
Sold by
Mccallum Susan and Mccallum Mary
Bought by
Mccallum Susan
Home Financials for this Owner
Home Financials are based on the most recent Mortgage that was taken out on this home.
Original Mortgage
$60,000
Interest Rate
7.08%
Purchase Details
Closed on
Sep 11, 1991
Bought by
Allen Todd C
Create a Home Valuation Report for This Property
The Home Valuation Report is an in-depth analysis detailing your home's value as well as a comparison with similar homes in the area
Home Values in the Area
Average Home Value in this Area
Purchase History
| Date | Buyer | Sale Price | Title Company |
|---|---|---|---|
| Allen Todd C | -- | Web Title Com | |
| Allen Todd Christian | $118,000 | -- | |
| Mccallum Susan | -- | -- | |
| Allen Todd C | $56,000 | -- |
Source: Public Records
Mortgage History
| Date | Status | Borrower | Loan Amount |
|---|---|---|---|
| Open | Allen Todd C | $130,400 | |
| Closed | Allen Todd Christian | $112,100 | |
| Previous Owner | Mccallum Susan | $60,000 |
Source: Public Records
Tax History
| Year | Tax Paid | Tax Assessment Tax Assessment Total Assessment is a certain percentage of the fair market value that is determined by local assessors to be the total taxable value of land and additions on the property. | Land | Improvement |
|---|---|---|---|---|
| 2025 | $1,690 | $20,512 | $7,106 | $13,406 |
| 2024 | $1,690 | $20,512 | $7,106 | $13,406 |
| 2023 | $1,667 | $17,668 | $7,772 | $13,581 |
| 2022 | $1,597 | $16,138 | $5,630 | $10,508 |
| 2021 | $1,618 | $16,603 | $5,792 | $10,811 |
| 2020 | $1,432 | $14,737 | $5,649 | $9,088 |
| 2019 | $1,409 | $14,737 | $5,649 | $9,088 |
| 2018 | $1,126 | $11,858 | $4,824 | $7,034 |
| 2017 | $1,111 | $13,110 | $5,333 | $7,777 |
| 2016 | $1,119 | $11,709 | $5,015 | $6,694 |
| 2015 | $1,067 | $8,469 | $2,786 | $5,683 |
| 2014 | $791 | $8,469 | $2,786 | $5,683 |
Source: Public Records
Map
Nearby Homes
- 36 Reed Place
- 29 Marshall Place
- 104 Rothrock Place
- 128 E 5th Ave
- 422 Atwood St
- 136 E 5th Ave
- 140 E 5th Ave
- 536 Atwood St
- 500 Lashley St Unit 48
- 306 Collyer St
- 240 Wadsworth Cir
- 400 Emery St Unit 202
- 244 Sorento Place
- 262 E 5th Ave
- 225 E 8th Ave Unit E20
- 225 E 8th Ave Unit F2
- 225 E 8th Ave Unit C14
- 830 Martin St
- 845 Martin St
- 10 9th Ave Unit 18
Your Personal Tour Guide
Ask me questions while you tour the home.