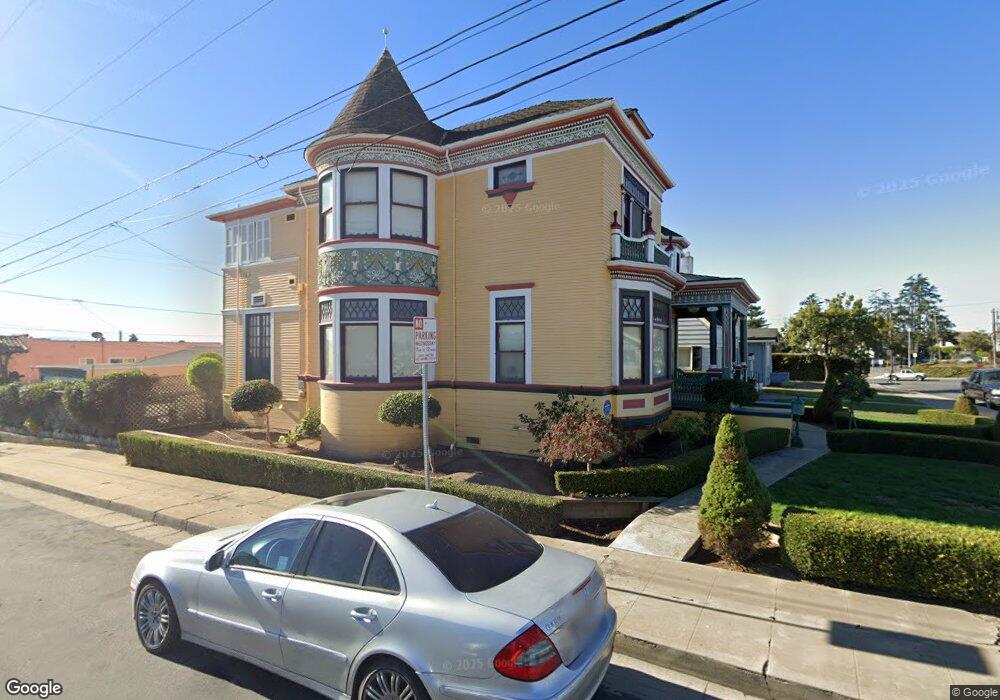
22 E High St Unit A Watsonville, CA 95076
Estimated Value: $652,000 - $912,000
2
Beds
2
Baths
360
Sq Ft
$2,259/Sq Ft
Est. Value
About This Home
This home is located at 22 E High St Unit A, Watsonville, CA 95076 and is currently estimated at $813,160, approximately $2,258 per square foot. 22 E High St Unit A is a home located in Santa Cruz County with nearby schools including Mintie White Elementary School, E.A. Hall Middle School, and Watsonville High School.
Ownership History
Date
Name
Owned For
Owner Type
Purchase Details
Closed on
Dec 9, 2021
Sold by
Byers Eileen and Byers Family Trust
Bought by
Byers Eileen and Byers Family Trust
Current Estimated Value
Purchase Details
Closed on
Aug 24, 2021
Sold by
Marvin Byers
Bought by
Byers Family Trust
Purchase Details
Closed on
Aug 20, 2012
Sold by
Byers Marvin and Byers Eileen
Bought by
Byers Marvin and Byers Eileen
Purchase Details
Closed on
May 29, 1997
Sold by
Belgard Bobby G and Belgard Janet M
Bought by
Byers Marvin and Byers Eileen
Home Financials for this Owner
Home Financials are based on the most recent Mortgage that was taken out on this home.
Original Mortgage
$60,000
Interest Rate
8.08%
Create a Home Valuation Report for This Property
The Home Valuation Report is an in-depth analysis detailing your home's value as well as a comparison with similar homes in the area
Home Values in the Area
Average Home Value in this Area
Purchase History
| Date | Buyer | Sale Price | Title Company |
|---|---|---|---|
| Byers Eileen | -- | None Available | |
| Byers Family Trust | -- | -- | |
| Byers Marvin | -- | None Available | |
| Byers Marvin | -- | None Available | |
| Byers Marvin | $210,000 | First American Title Ins Co |
Source: Public Records
Mortgage History
| Date | Status | Borrower | Loan Amount |
|---|---|---|---|
| Previous Owner | Byers Marvin | $60,000 | |
| Closed | Byers Marvin | $89,000 |
Source: Public Records
Tax History Compared to Growth
Tax History
| Year | Tax Paid | Tax Assessment Tax Assessment Total Assessment is a certain percentage of the fair market value that is determined by local assessors to be the total taxable value of land and additions on the property. | Land | Improvement |
|---|---|---|---|---|
| 2025 | $4,060 | $350,157 | $162,873 | $187,284 |
| 2023 | $3,996 | $336,560 | $156,548 | $180,012 |
| 2022 | $3,924 | $329,961 | $153,479 | $176,482 |
| 2021 | $3,855 | $323,491 | $150,469 | $173,022 |
| 2020 | $3,800 | $320,175 | $148,927 | $171,248 |
| 2019 | $3,731 | $313,896 | $146,006 | $167,890 |
| 2018 | $3,636 | $307,742 | $143,144 | $164,598 |
| 2017 | $3,602 | $301,706 | $140,337 | $161,369 |
| 2016 | $3,507 | $295,790 | $137,585 | $158,205 |
| 2015 | $3,494 | $291,347 | $135,518 | $155,829 |
| 2014 | $3,417 | $285,640 | $132,863 | $152,777 |
Source: Public Records
Map
Nearby Homes
- 932 Lincoln St
- 3 Gonzales St
- 105 Palm Ave
- 67 Roosevelt St
- 110 Crespi Cir Unit 110
- 20 Marin St
- 35 Sycamore St
- 708 Hill Ave
- 254 Rogers Ave
- 176 Crestview Ct
- 30 W Lake Ave
- 630 California St
- 441 Center St
- 229 Pacifica Blvd Unit 104
- 234 Maple Ave
- 1060 Sunbird Dr
- 229 Bronson St
- 128 Maple Ave
- 145 Alma St
- 1201 Brewington Ave
- 18 E High St
- 14 E High St
- 100 E High St
- 327 Jefferson St
- 10 W High St
- 104 E High St
- 104 W High St
- 321 Jefferson St
- 326 Jefferson St
- 21 E High St
- 17 E High St Unit A
- 108 E High St
- 317 Jefferson St
- 15 E High St
- 328 Jefferson St Unit B
- 328 Jefferson St Unit A
- 406 Jefferson St
- 902 Freedom Blvd
- 850 Freedom Blvd
- 846 Freedom Blvd