Estimated Value: $148,466 - $216,000
2
Beds
1
Bath
708
Sq Ft
$264/Sq Ft
Est. Value
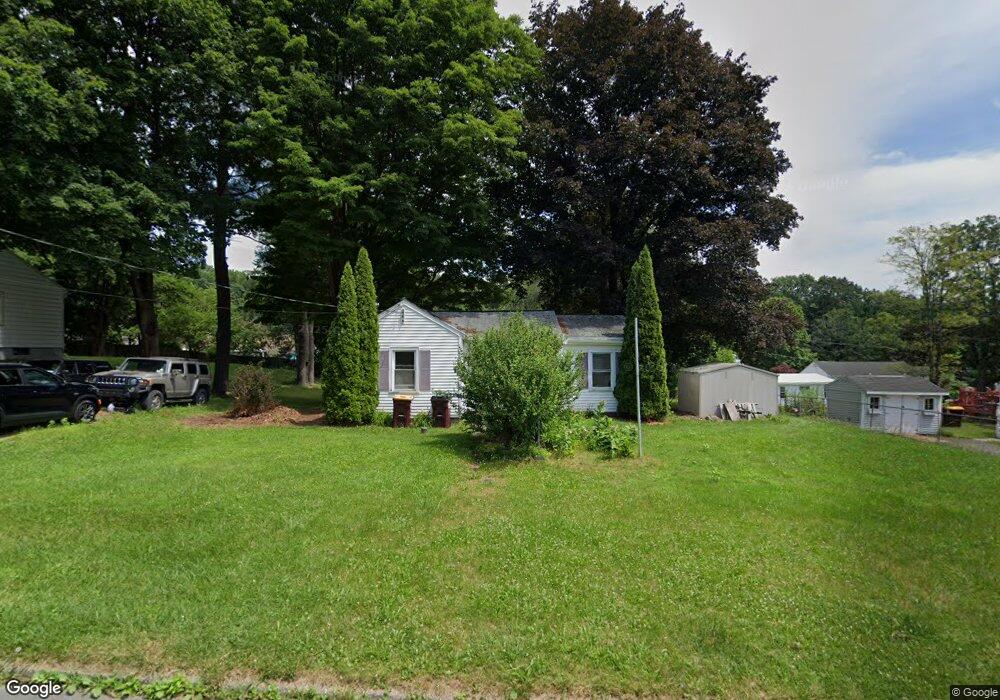
About This Home
This home is located at 22 Fane Ct, Troy, NY 12182 and is currently estimated at $186,617, approximately $263 per square foot. 22 Fane Ct is a home located in Rensselaer County with nearby schools including Turnpike Elementary School, Rensselaer Park Elementary School, and Knickerbacker Middle School.
Ownership History
Date
Name
Owned For
Owner Type
Purchase Details
Closed on
Sep 19, 2023
Sold by
Krupski Nancy Est and Rescott
Bought by
Rescott John J
Current Estimated Value
Purchase Details
Closed on
Dec 22, 2006
Sold by
Smith Edgar
Bought by
Krupski Nancy
Home Financials for this Owner
Home Financials are based on the most recent Mortgage that was taken out on this home.
Original Mortgage
$89,040
Interest Rate
8%
Mortgage Type
Purchase Money Mortgage
Purchase Details
Closed on
Jun 28, 2005
Home Financials for this Owner
Home Financials are based on the most recent Mortgage that was taken out on this home.
Original Mortgage
$25,165
Interest Rate
5.71%
Mortgage Type
Purchase Money Mortgage
Purchase Details
Closed on
May 31, 2002
Sold by
Le Boeuf Joseph E
Bought by
Smith Edgar B
Create a Home Valuation Report for This Property
The Home Valuation Report is an in-depth analysis detailing your home's value as well as a comparison with similar homes in the area
Home Values in the Area
Average Home Value in this Area
Purchase History
We collect this data history from publicly available records. To have your information removed, we recommend requesting removal directly through your county’s website.
| Date | Buyer | Sale Price | Title Company |
|---|---|---|---|
| Rescott John J | -- | None Available | |
| Krupski Nancy | $111,300 | -- | |
| -- | -- | -- | |
| Smith Edgar B | $67,000 | Timothy P. Kelleher | |
| Le Boeuf Joseph E | $48,000 | -- |
Source: Public Records
Mortgage History
We collect this data history from publicly available records. To have your information removed, we recommend requesting removal directly through your county’s website.
| Date | Status | Borrower | Loan Amount |
|---|---|---|---|
| Previous Owner | Krupski Nancy | $89,040 | |
| Previous Owner | -- | $25,165 |
Source: Public Records
Tax History
| Year | Tax Paid | Tax Assessment Tax Assessment Total Assessment is a certain percentage of the fair market value that is determined by local assessors to be the total taxable value of land and additions on the property. | Land | Improvement |
|---|---|---|---|---|
| 2025 | $5,538 | $27,000 | $4,300 | $22,700 |
| 2024 | $5,538 | $27,000 | $4,300 | $22,700 |
| 2023 | $3,216 | $26,800 | $4,300 | $22,500 |
| 2022 | $3,208 | $26,800 | $4,300 | $22,500 |
| 2021 | $5,690 | $26,800 | $4,300 | $22,500 |
| 2020 | $3,654 | $26,800 | $4,300 | $22,500 |
| 2019 | $3,666 | $26,800 | $4,300 | $22,500 |
| 2018 | $3,666 | $26,800 | $4,300 | $22,500 |
| 2017 | $3,010 | $26,800 | $4,300 | $22,500 |
| 2016 | $3,016 | $26,800 | $4,300 | $22,500 |
| 2015 | -- | $26,800 | $4,300 | $22,500 |
| 2014 | -- | $26,800 | $4,300 | $22,500 |
Source: Public Records
Map
Nearby Homes
- 23 Brickyard Rd
- 27 Plank Rd
- 11 Tague Rd
- 208 N Ridge
- 17 Avenue A
- 12 Sunset Dr
- 22 Hialeah Dr
- 46 Biscayne Blvd
- 3604 Brunswick Meadows Way
- 897 8th Ave
- 66 New Turnpike Rd
- 347 Hillcrest St
- 325 Belgrade St
- 34 New Turnpike Rd
- 311 Belgrade St
- 58 Lori Jean Place
- 6 Chelsea Ct
- 1142 River Rd
- 25 Stratton Cir
- 104 Haughney Rd
Your Personal Tour Guide
Ask me questions while you tour the home.